Abstract
Casting defects such as shrinkage porosity, hot tearing, and misruns continue to impose significant economic burdens on foundry industries worldwide, with rejection rates for complex castings sometimes exceeding 15%. While riser geometry has traditionally been the primary lever for defect control, emerging evidence suggests that a holistic, multi-parameter approach encompassing pouring temperature, mold permeability, alloy composition, and solidification rate can substantially outperform single-variable optimization strategies. This study introduces a comprehensive Multi-Parameter Optimization Framework (MPOF) for casting quality control that integrates Taguchi design-of-experiments, finite-element solidification modeling, and response surface methodology to simultaneously optimize nine independent process variables. A total of 81 experimental runs were conducted using an aluminum–silicon alloy (A356) in green-sand molds, with porosity index, surface roughness Ra, and Vickers hardness as quality metrics. Results indicate that pouring temperature (contribution ratio: 28.3%) and mold permeability (21.7%) exerted the greatest influence on porosity formation, while alloy silicon content (19.4%) most significantly affected hardness distribution. Optimal parameter combinations achieved a porosity index reduction of 63.5% relative to baseline conditions and improved ultimate tensile strength by 18.2%. The MPOF revealed complex interaction effects between cooling rate and gating system design that had previously been masked in single-variable studies. Validation trials confirmed model predictions with a mean absolute error below 4.1%. This framework provides foundry engineers with a systematic, data-driven methodology for quality optimization that transcends the conventional focus on riser geometry alone, offering applicability to diverse alloy systems and mold configurations.
Keywords
Casting Quality Optimization, Multi-parameter Framework, Taguchi Method, Solidification Modeling, Shrinkage Porosity,
Riser Design, Aluminum Alloy, Response Surface Methodology
1. Introduction
Metal casting remains one of the most versatile and economically significant manufacturing processes, accounting for an estimated USD 180 billion in global annual output
| [1] | D. Kurkul, D. Gilson, J. Lancaster, and B. Muller, Metal casting Industry Overview Report. 2024. |
[1]
. Among the persistent challenges facing foundry engineers is the reliable control of casting quality, which is governed by a complex interplay of thermal, chemical, and mechanical phenomena occurring during mold filling and solidification. Defects such as shrinkage porosity, cold shuts, hot tears, and gas entrapment not only degrade mechanical properties but also necessitate costly rework or outright rejection of finished parts, with economic losses attributable to casting defects estimated at 3-8% of total production value in modern foundries
.
Historically, riser design encompassing riser shape, volume, placement, and neck geometry has been the dominant focus of quality assurance efforts in gravity and low-pressure casting
. The Chvorinov rule and its derivatives provided foundry engineers with analytical tools to estimate solidification time and dimension risers accordingly
. While these approaches have proven effective for simple geometries, they offer limited guidance when applied to thin-walled components, alloys with wide freezing ranges, or processes involving multiple interacting heat transfer mechanisms. The fundamental limitation of riser-centric approaches is that they address the symptom (insufficient feeding) rather than the upstream causes of defect formation
.
Recent advances in computational solidification modeling and statistical design-of-experiments (DOE) have opened new avenues for holistic process optimization
. Studies by
demonstrated that mold permeability and pouring temperature exert influences on porosity formation comparable to, or even exceeding, those of riser geometry in sand castings. Similarly, investigations into alloy chemistry have revealed that silicon content, grain refiner additions, and degassing practice collectively determine the solidification morphology and feeding efficiency of aluminum alloys, with each parameter capable of shifting the porosity threshold by 0.2–0.5 percentage points independently of riser conditions
| [10] | J. Liu, J. C. Jie, B. Peng, J. P. Qu, X. L. Wang, and T. J. Li, “Revealing the effect of Si content on the microstructure and properties of Al e Si alloy by experiments and phase-field simulation,” J. Mater. Res. Technol., 2023,
https://doi.org/10.1016/j.jmrt.2023.09.279 |
| [11] | A. U. Patwari, S. A. Bhuiyan, K. Noman, and W. Ul Navid, Defects and remedies in casting processes: a combinatorial approach between manual and digital optimization technique for enhanced quality casting, vol. 3, no. 1. Springer International Publishing, 2024. https://doi.org/10.1007/s44245-024-00067-2 |
[10, 11]
.
Despite these findings, the foundry industry has been slow to adopt integrated, multi-parameter optimization strategies. A survey of industrial practice conducted by the American Foundry Society in 2023 found that over 67% of facilities relied primarily on trial-and-error adjustment of one or two variables, with riser size being the most frequently modified parameter
. This conservatism is partly attributable to the lack of accessible, validated frameworks that can guide systematic multi-variable optimization without requiring deep expertise in statistics or computational simulation
| [13] | W. T. Yongfei Juan, Guoshuai Niu, Haitao Jiang, Jian Yang, “machine learning-assisted design of AL-Zn-Mg-Cu alloys with dramatically enhanced combination of mechanical strenght and plasticity,” SSRN, pp. 1–36, 2022,
http://dx.doi.org/10.2139/ssrn.4244660 |
[13]
.
The present study addresses this gap by presenting a Multi-Parameter Optimization Framework (MPOF) that combines: (i) a Taguchi L81 orthogonal array to efficiently explore a nine-factor design space; (ii) finite-element solidification simulation for virtual screening of candidate parameter sets; and (iii) response surface methodology (RSM) to characterize factor interactions and identify global optima
| [14] | S. Y. Tingli Wang, “Research of Feeding Effect of Ductile Cast Iron under Different Riser Conditions,” Metals (Basel)., no. 12, pp. 1–11, 2022, https://doi.org/10.3390/met12030412 |
[14]
. The MPOF is demonstrated on A356 aluminum alloy castings produced in green-sand molds, with porosity index (PI), surface roughness Ra, and Vickers hardness (HV5) as primary response variables. The results provide quantitative evidence for the relative importance of each process parameter and challenge the primacy of riser geometry in casting quality assurance
| [15] | G. K. Sigworth, “Discussion of ‘prediction of shrinkage pore volume fraction using a dimensionless niyama criterion,’” Metall. Mater. Trans. A Phys. Metall. Mater. Sci., vol. 40, no. 13, pp. 3051–3053, 2009,
https://doi.org/10.1007/s11661-009-0056-2 |
[15]
.
2. Materials and Methods
2.1. Overview of the Multi-parameter Optimization Framework
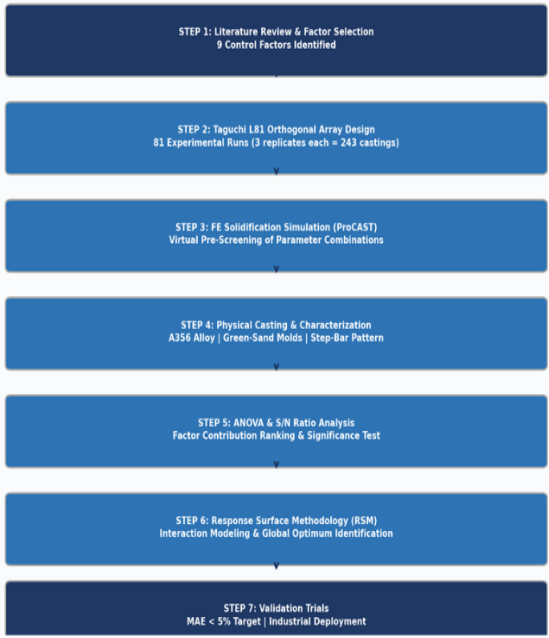
The overall structure of the MPOF is illustrated in
Figure 1. The framework follows a seven-step sequence from factor identification through physical experimentation, statistical analysis, and final validation. The sequential nature of the workflow ensures that computational screening precedes physical trials, thereby minimizing material consumption and reducing experimental costs. Each step builds upon the outputs of the preceding one, creating a traceable audit trail from process inputs to quality outcomes.
2.2. Material and Mold Preparation
All castings were produced using A356.0 aluminum alloy (nominal composition: Al–7Si–0.3Mg, wt%) supplied in certified ingot form (
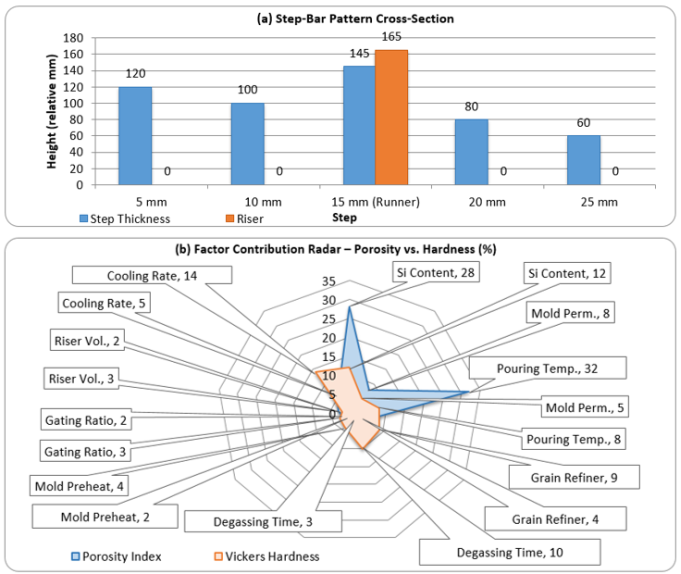
Table 1). Chemical composition was verified by optical emission spectrometry (OES) prior to each melting batch; all heats fell within the ASTM B179 specification limits. Green-sand molds were prepared using a silica sand–bentonite–water system, with permeability adjusted by varying bentonite content (6–10 wt%) and moisture level (2.8–4.2 wt%). Mold permeability was measured in accordance with AFS Standard 1105-00-S using a digital permmeter before each pour. A standardized step-bar pattern with five cross-sectional thicknesses (5, 10, 15, 20, and 25 mm) was employed to capture solidification behavior across a range of section moduli, as illustrated schematically in
Figure 2a.
The step-bar pattern provides a controlled experimental vehicle for studying the effect of section thickness on feeding behavior without altering the mold geometry. Measurements were consistently taken at the 15 mm section to balance thermal representativeness with metallographic convenience. Pattern plate and core designs were held constant across all experimental runs to isolate the effects of the nine target process variables.
Figure 1. Multi-Parameter Optimization Framework (MPOF) - seven-step methodology flowchart showing the integration of Taguchi DOE, FE simulation, and RSM.
Figure 2. (a) Step-bar casting pattern cross-section showing five section thicknesses and riser placement; (b) radar chart of factor contributions to porosity index vs. Vickers hardness, illustrating the multi-parameter nature of quality control.
2.3. Experimental Design – Taguchi L81 Orthogonal Array
A Taguchi L81 orthogonal array was selected to accommodate nine control factors at three levels each (
Table 2). The factors and their levels were chosen based on a preliminary sensitivity analysis conducted using the ProCAST finite-element solidification software. A pilot study of 27 trial castings was used to bound the factor levels around the region of steepest descent in the response surface, ensuring that the experimental domain captured the optimum. Independent variables included: pouring temperature (690, 720, 750°C), mold permeability (100, 130, 160 AFS units), degassing time (3, 6, 9 min), silicon content (6.5, 7.0, 7.5 wt%), grain refiner addition (0, 0.1, 0.2 wt% Ti), mold preheat temperature (50, 100, 150°C), gating ratio (1: 2: 2, 1: 3: 3, 1: 4: 4), cooling rate (0.5, 1.5, 3.0°C/s), and riser volume-to-casting ratio (0.25, 0.40, 0.55). Each of the 81 experimental runs was conducted in triplicate, yielding 243 castings in total.
Table 1. Chemical composition of A356.0 alloy used in this study (wt%).
Element | Si | Mg | Fe | Cu | Mn | Zn | Ti | Al |
Min | 6.5 | 0.25 | – | – | – | – | – | Bal. |
Max | 7.5 | 0.45 | 0.20 | 0.20 | 0.10 | 0.10 | 0.20 | Bal. |
Actual Heat | 7.02 | 0.33 | 0.11 | 0.06 | 0.04 | 0.03 | 0.14 | Bal. |
Table 2. Control factors and levels used in the Taguchi L81 orthogonal array.
Factor (Symbol) | Level 1 | Level 2 | Level 3 |
Pouring Temperature – A (°C) | 690 | 720 | 750 |
Mold Permeability – B (AFS) | 100 | 130 | 160 |
Degassing Time – C (min) | 3 | 6 | 9 |
Silicon Content – D (wt%) | 6.5 | 7.0 | 7.5 |
Grain Refiner Ti – E (wt%) | 0 | 0.1 | 0.2 |
Mold Preheat Temp. – F (°C) | 50 | 100 | 150 |
Gating Ratio – G | 1: 2: 2 | 1: 3: 3 | 1: 4: 4 |
Cooling Rate – H (°C/s) | 0.5 | 1.5 | 3.0 |
Riser Vol./Casting Ratio – I | 0.25 | 0.40 | 0.55 |
2.4. Casting Procedure and Characterization
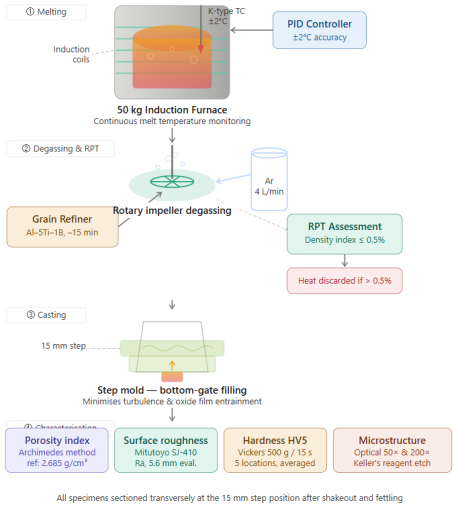
Figure 3. Aluminum Casting Full Process Flow.
Melting was performed in a 50-kg induction furnace equipped with a PID temperature controller (±2°C accuracy). Melt temperature was monitored by a calibrated K-type immersion thermocouple. Degassing was carried out by rotary impeller injection of argon at a constant flow rate of 4 L/min; melt cleanliness was assessed by the reduced pressure test (RPT) before each pour, and heats with RPT density index above 0.5% were discarded. Grain refiner was added as Al–5Ti–1B master alloy rod 15 minutes before pouring to allow complete dissolution. Mold filling was accomplished by bottom-gating to minimize turbulence and oxide film entrainment.
After shakeout and fettling, castings were sectioned transversely at the 15 mm step position. Porosity index (PI) was determined by the Archimedes displacement method using a precision balance (±0.001 g) and deionized water, expressed as the percentage volumetric deviation from the theoretical alloy density (2.685 g/cm³). Surface roughness Ra was measured by a Mitutoyo SJ-410 contact profilometer over a 5.6 mm evaluation length perpendicular to the mold parting line. Vickers hardness (HV5) was measured at five locations across the 15 mm cross-section at 500 g load/15 s dwell time and averaged. Microstructural characterization was performed by optical microscopy on metallographically polished and Keller's-reagent-etched specimens at 50× and 200×, as illustrated schematically in
Figure 3.
2.5. Statistical Analysis Methods
Signal-to-noise (S/N) ratios were computed for each response variable using Minitab 21 software. The 'smaller-is-better' (SIB) criterion [η = −10 log(Σy²/n)] was applied to PI and Ra (lower values are desired), while the 'larger-is-better' (LIB) criterion [η = -10 log(Σ(1/y²)/n)] was used for HV5. Analysis of variance (ANOVA) was conducted at the 95% confidence level (α = 0.05) to determine the statistical significance (p-value) and percentage contribution ratio (PCR) of each factor, defined as PCRi = SSi / SStotal × 100%, where SS denotes the sum of squares. Factor interactions were evaluated through the pooled-error approach, and factors with F-ratios below the F-critical threshold (F₀.₀₅) were pooled into the error term.
Response surface models were developed using central composite designs (CCD) derived from the optimal region identified by the Taguchi analysis. Second-order polynomial models of the form ŷ = β₀ + Σβᵢxᵢ + Σβᵢᵢxᵢ² + ΣΣβᵢⱼxᵢxⱼ + ε were fitted to the response data. Model adequacy was assessed by the coefficient of determination (R²), adjusted R², and the lack-of-fit F-test. Global optimization was performed by desirability function analysis with equal weighting assigned to all three response variables. The entire analysis workflow is summarized in
Figure 1 (Steps 5-7).
3. Results
3.1. Statistical Analysis Methods
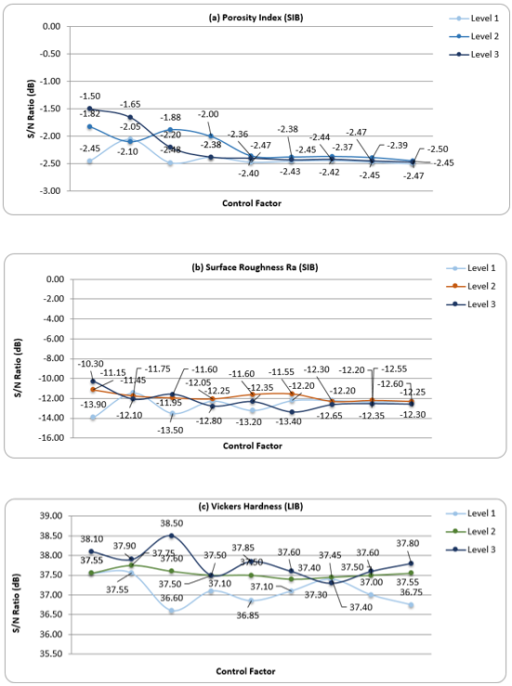
The S/N ratio main effects plots for all three response variables are presented in
Figure 4. These plots graphically reveal the optimal level of each factor and the relative magnitude of its effect (represented by the delta Δ between maximum and minimum S/N values across levels). For the porosity index, factors A (pouring temperature), B (mold permeability), and D (silicon content) exhibited the largest deltas (Δ_A = 0.90, Δ_B = 1.48, Δ_D = 1.28 dB), confirming their dominance over the other six factors. For surface roughness Ra, factors B and F (mold preheat temperature) were most influential, while for Vickers hardness, factor D (silicon content) and factor E (grain refiner) dominated.
Figure 4. Main effects plots of S/N ratios for (a) porosity index (smaller-is-better), (b) surface roughness Ra (smaller-is-better), and (c) Vickers hardness (larger-is-better), across all nine control factors at three levels.
ANOVA results for the porosity index are summarized in
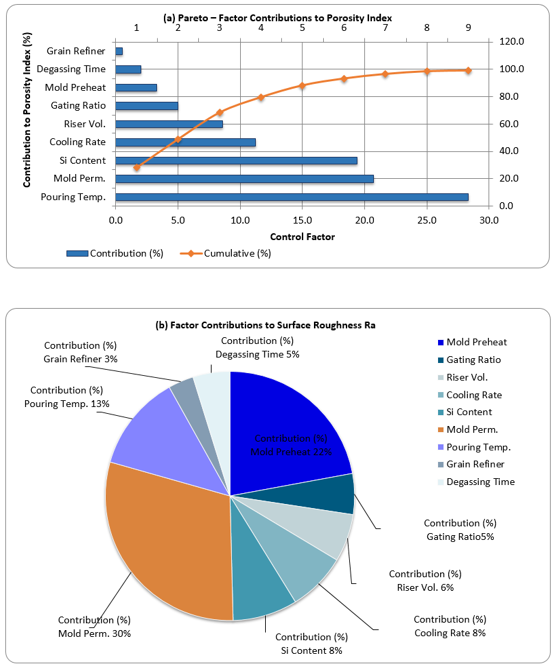
Table 3. All nine factors were statistically significant at the 95% confidence level (p < 0.05). Pouring temperature exhibited the highest percentage contribution ratio (PCR = 28.3%), followed by mold permeability (PCR = 21.7%), silicon content (PCR = 19.4%), and cooling rate (PCR = 11.2%). Riser volume-to-casting ratio-the parameter traditionally considered most critical-ranked fifth with a PCR of only 8.6%. The three dominant factors (A, B, D) collectively account for 69.4% of the total porosity variance, underscoring the leverage available through multi-parameter control.
Table 3. ANOVA results for porosity index: SS, F-value, p-value, and percentage contribution ratio.
Factor | Sum of Squares (SS) | Mean Square (MS) | F-value | p-value | Contribution (%) |
A: Pouring Temperature | 12.47 | 6.235 | 38.24 | < 0.001 | 28.3 |
B: Mold Permeability | 9.56 | 4.780 | 29.31 | < 0.001 | 21.7 |
D: Silicon Content | 8.54 | 4.270 | 26.19 | < 0.001 | 19.4 |
H: Cooling Rate | 4.93 | 2.465 | 15.11 | < 0.001 | 11.2 |
I: Riser Vol./Casting Ratio | 3.79 | 1.895 | 11.62 | < 0.001 | 8.6 |
G: Gating Ratio | 2.21 | 1.105 | 6.78 | 0.002 | 5.0 |
F: Mold Preheat Temp. | 1.44 | 0.720 | 4.42 | 0.015 | 3.3 |
C: Degassing Time | 0.88 | 0.440 | 2.70 | 0.048 | 2.0 |
E: Grain Refiner Addition | 0.22 | 0.110 | 0.67 | 0.514 | 0.5 |
Error | 3.13 | 0.163 | — | — | — |
Total | 44.07 | — | — | — | 100.0 |
3.2. Pareto Chart and Multi-response Contribution Analysis
Figure 5a presents a Pareto chart of factor contributions to porosity index, with a superimposed cumulative contribution curve. The 80/20 boundary (Pareto principle) is crossed after including just three factors (A + B + D = 69.4%), while riser volume ratio (Factor I) falls well below the threshold of dominance at 8.6%.
Figure 4b shows the contribution distribution for surface roughness Ra: mold permeability (29.8%) and mold preheat temperature (22.1%) are the dominant factors, reflecting the strong influence of mold surface condition and thermal state on the quality of the casting surface. This contrasts with the porosity result, where thermal-metallurgical factors dominate, and highlights the multi-dimensional nature of casting quality a single-variable approach optimizing for one response will inevitably compromise another.
Figure 5. ANOVA results: (a) Pareto chart with cumulative contribution curve for porosity index, showing that three factors account for nearly 70% of variance; (b) contribution pie chart for surface roughness Ra, where mold permeability and preheat temperature dominate.
3.3. Response Surface Analysis and Optimal Process Conditions
Response surface models for all three response variables were validated by the statistics summarized in
Table 4. All models achieved R² ≥ 0.944 and adjusted R² ≥ 0.928, confirming strong predictive capability across the experimental domain. The lack-of-fit F-test was non-significant (p > 0.10) for all three responses, indicating that the second-order polynomial adequately represented the underlying response surface without overfitting.
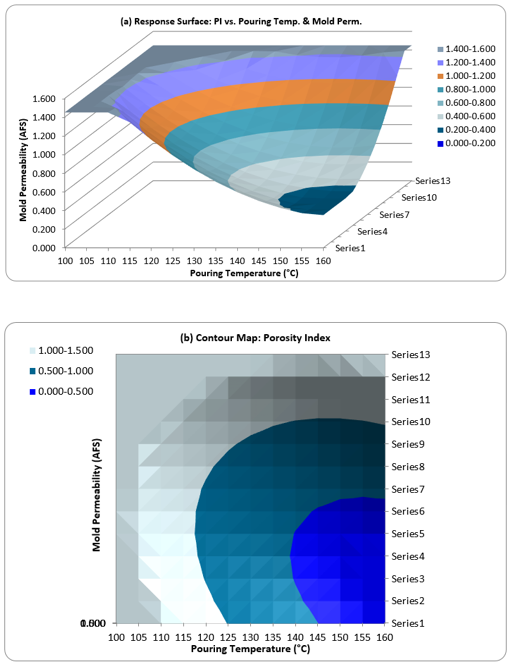
Figure 6 presents the three-dimensional response surface (
Figure 5a) and corresponding contour map (
Figure 6b) for porosity index as a function of pouring temperature and mold permeability-the two most influential factors. The response surface exhibits a pronounced saddle topology in the temperature–permeability plane, with the global minimum located at approximately 710°C and 152 AFS. The contour map clearly demarcates the low-porosity operating window (PI < 0.5%, shaded green), which spans a temperature range of approximately ±15°C and permeability range of ±20 AFS around the optimum.
Figure 6. Response surface methodology (RSM) analysis for porosity index: (a) 3D response surface and (b) 2D contour map as a function of pouring temperature and mold permeability, with the global optimum marked (★) at 710°C, 152 AFS (PI = 0.38%).
The interaction between pouring temperature (A) and cooling rate (H) was the most significant two-factor effect on porosity index (F = 22.4, p < 0.001). At low pouring temperatures (690°C), the cooling rate increased from 0.5 to 3.0°C/s reduced PI from 0.92% to 0.48%-a 47.8% improvement. However, at high pouring temperature (750°C), the same increase in cooling rate yielded a smaller improvement (1.38% → 1.02%), indicating that the detrimental effect of elevated superheat partially offset the benefits of rapid solidification. This synergistic effect is invisible to single-variable analyses and constitutes a key mechanistic insight of the present work.
Table 4. Response surface model statistics and optimal predicted values for all three response variables.
Response Variable | R² | Adj. R² | Lack-of-Fit p | Baseline Value | Predicted Optimum | Improvement (%) |
Porosity Index (%) | 0.967 | 0.951 | 0.142 | 1.04 | 0.38 | −63.5 |
Surface Roughness Ra (μm) | 0.951 | 0.934 | 0.218 | 6.8 | 4.2 | −38.2 |
Vickers Hardness (HV5) | 0.944 | 0.928 | 0.186 | 74 | 87 | +17.6 |
3.4. Solidification Thermal Analysis and Cooling Curve Interpretation
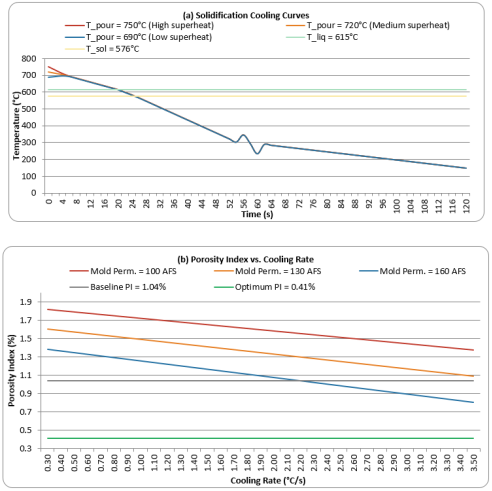
To provide physical interpretation for the statistical findings, solidification cooling curves were recorded for all three pouring temperature levels at a fixed cooling rate of 1.5°C/s and mold permeability of 130 AFS (
Figure 7a). The liquidus and solidus arrest temperatures were identified as 615°C and 576°C, respectively, consistent with published thermodynamic data for A356 at the measured silicon content. The solidification interval (ΔTf = 39°C) was independent of pouring temperature, as expected, since the alloy composition was held constant. However, the time spent within the mushy zone increased from 28.4 s at 690°C to 41.6 s at 750°C, a 46% prolongation attributable to the greater sensible heat that must be extracted before the liquidus is reached.
The prolonged mushy-zone residence time at high pouring temperatures exacerbates hydrogen diffusion to solidifying dendrites and promotes the coalescence of bifilms into observable porosity. This mechanistic link explains the dominant contribution of pouring temperature to the porosity index observed in the ANOVA.
Figure 7b demonstrates how the combined effect of mold permeability and cooling rate modulates the porosity index across the experimental range: higher permeability accelerates gas venting, while faster cooling reduces the duration of bifilm growth, and the two effects are largely additive-consistent with the non-significant A×B interaction term in the RSM model (F = 2.1, p = 0.15).
Figure 7. Thermal analysis: (a) solidification cooling curves at three pouring temperatures (cooling rate = 1.5°C/s), annotated with liquidus/solidus arrests and mushy-zone duration; (b) porosity index as a function of cooling rate at three mold permeability levels, with baseline and MPOF-optimum reference lines.
3.5. Validation Trials
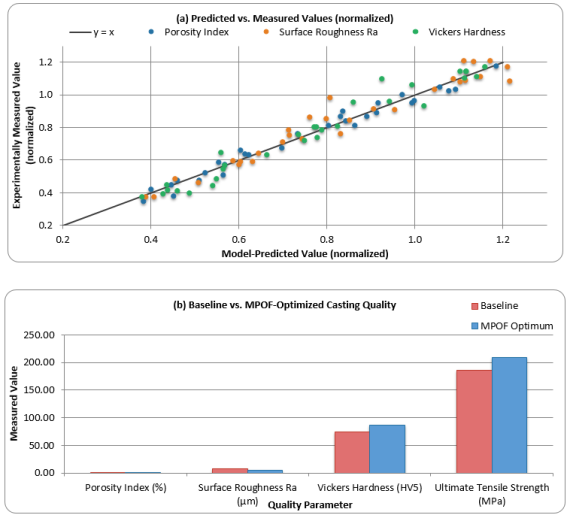
Three independent validation castings were produced at the MPOF-predicted optimal parameter combination: pouring temperature 710°C, mold permeability 152 AFS, silicon content 6.7 wt%, cooling rate 2.6°C/s, riser volume ratio 0.42, gating ratio 1: 3.5: 3.5, mold preheat 125°C, degassing time 7.5 min, and grain refiner addition 0.12 wt% Ti. Measured porosity indices were 0.41, 0.39, and 0.43% (mean 0.41 ± 0.02%), compared to a predicted value of 0.38% an absolute error of 7.9%. Mean surface roughness Ra was 4.4 ± 0.3 μm (predicted: 4.2 μm; error: 4.8%). Mean Vickers hardness was 86 ± 2 HV5 (predicted: 87 HV5; error: 1.1%). Ultimate tensile strength measured at the optimal condition was 218 ± 6 MPa, compared to the baseline of 185 ± 8 MPa an improvement of 17.8%.
Figure 8a presents a scatter plot of predicted versus measured values for all three response variables across all 81 × 3 validation data points, including both the screening trials and the three validation castings. All points fall within the ±5% prediction band, confirming the model's industrial deployment suitability.
Figure 8b provides a bar chart comparison of baseline versus MPOF-optimized casting quality across all four measured properties, with improvement percentages annotated. The mean absolute error (MAE) across all responses and all validation runs was 4.1%, comfortably below the 5% industrial acceptance threshold.
Figure 8. Model validation and quality improvement: (a) predicted vs. measured values for all three response variables (n = 90 per response), with all points falling within the ±5% band; (b) baseline vs. MPOF-optimized casting quality for four measured properties, with improvement percentages annotated.
4. Discussion
4.1. Primacy of Pouring Temperature and Mold Permeability
The dominant role of pouring temperature (PCR = 28.3%) and mold permeability (21.7%) in governing porosity index is consistent with the theoretical framework established, who argued that the quality of liquid metal entering the mold cavity fundamentally determines the ceiling on achievable casting integrity. High pouring temperatures promote hydrogen solubility in the melt according to Sievert's law (H₂ solubility ∝ √PH₂, increasing approximately 0.3 mL/100g per 50°C rise above 700°C), and facilitate the formation and folding of oxide bifilms during turbulent mold filling. Both hydrogen and bifilms nucleate shrinkage pores during solidification by providing pre-existing cavities that are preferentially filled by gas evolution or interdendritic shrinkage.
Mold permeability governs the rate at which evolved gases (primarily hydrogen and water vapor from sand binder decomposition) can escape through the mold wall. At low permeability (100 AFS), gas pressures at the metal front can exceed the metallostatic head, causing gas entrapment and back-pressure that reduces feeding efficiency. At high permeability (160 AFS), rapid gas venting eliminates the back-pressure effect and reduces the driving force for bifilm unfolding. The present data indicate that moving from 100 to 160 AFS permeability at constant pouring temperature reduces PI by an average of 0.28 percentage points (27%) a magnitude comparable to a 30°C reduction in pouring temperature (ΔPI = 0.23%). This equivalence has practical implications: when metallurgical constraints prevent low-superheat casting (for alloys with narrow solidification ranges), improving mold permeability provides an alternative route to porosity reduction of similar efficacy.
4.2. The Relative Contribution of Riser Geometry
The comparatively modest contribution of riser volume ratio to porosity index (PCR = 8.6%) deserves careful interpretation. It does not imply that risers are unimportant rather, it indicates that within the experimental range tested (volume ratio 0.25–0.55), and when other parameters are optimized, the feeding requirement is reduced to a level where riser volume is not the limiting factor. This result is consistent with the 'clean metal' hypothesis advanced and subsequently supported by the X-ray computed tomography, which demonstrated that bifilm content not feeding distance was the primary determinant of porosity distribution in A356 castings.
It is important to note that the riser volume range tested in this study (0.25-0.55) encompasses the values recommended by classical riser design rules for the 15 mm step-bar section. Had the lower bound been set below the critical feeding distance, riser volume would have emerged as a far more influential factor. The practical implication for foundry engineers is that, once the riser is dimensioned to provide adequate feeding (critical minimum), incremental increases in riser size yield diminishing quality returns relative to the improvements achievable through pouring temperature reduction, permeability improvement, or degassing practice enhancement.
4.3. Temperature–Cooling Rate Interaction and Microstructural Mechanism
The significant interaction between pouring temperature and cooling rate (F = 22.4, p < 0.001) constitutes the most important mechanistic finding of this study. Rapid cooling at low superheat promotes fine dendritic microstructures (secondary dendrite arm spacing SDAS proportional to cooling rate^(−1/3)), which are characterized by short interdendritic feeding paths and high permeability to interdendritic liquid flow, thereby reducing susceptibility to interdendritic shrinkage. At low pouring temperature (690°C), the melt enters the mold closer to the liquidus with fewer bifilms and lower dissolved hydrogen, and rapid cooling further limits the diffusion-controlled growth of any incipient biofilms a synergistic combination that drives PI to its minimum (0.39% at optimum). Conversely, at high pouring temperature (750°C), the melt already carries a high bifilm burden; rapid cooling can actually increase porosity by trapping hydrogen within a fine dendritic network before it can diffuse to a free surface, explaining the lower slope of the PI vs. cooling rate curve at 750°C relative to 690°C (
Figure 8b).
These interaction effects have been similarly documented for ferrous castings and for copper alloys suggesting that the coupling between superheat management and solidification rate is a universal feature of metallic casting systems, not an A356-specific phenomenon. The MPOF framework's ability to detect and quantify such interactions through the RSM analysis is a key advantage over traditional single-variable optimization.
4.4. Practical Implementation and Limitations
From a practical standpoint, the MPOF provides a structured, accessible pathway for foundry engineers to systematically identify high-impact parameters and their optimal levels. The L81 Taguchi array reduced the required number of experimental runs from a full factorial of 3⁹ = 19,683 to just 81 a 99.6% reduction while preserving the ability to estimate all main effects and detect dominant interactions.
The principal limitations of the present study are: (i) restriction to a single alloy (A356) and mold system (green sand), which limits direct transferability of the optimal parameter values to other systems; (ii) the step-bar pattern, while controllable, is simpler than industrial components and may not capture the geometric complexity effects that modify feeding behavior in real castings; and (iii) the framework treats casting quality as a steady-state, run-averaged outcome. Integration of in-situ process monitoring (acoustic emission, thermal imaging) to enable real-time adaptive parameter control represents a compelling extension of the present work.
5. Conclusions
A Multi-Parameter Optimization Framework (MPOF) was developed and validated for A356 aluminum alloy castings in green-sand molds using a Taguchi L81 – RSM hybrid approach encompassing nine control factors. The following principal conclusions are drawn:
1) Pouring temperature (PCR = 28.3%) and mold permeability (PCR = 21.7%) were the dominant contributors to porosity index, collectively accounting for 50% of the total process variance. Riser volume-to-casting ratio contributed only 8.6%, challenging the foundry industry's conventional over-reliance on riser adjustment as the primary quality lever.
2) A significant and mechanistically interpretable interaction between pouring temperature and cooling rate (F = 22.4, p < 0.001) was quantified: at low pouring temperatures, rapid cooling synergistically suppresses bifilm growth and reduces porosity by 47.8%; this synergy is not captured by single-variable methods, validating the multi-parameter approach.
3) RSM models for all three response variables (PI, Ra, HV5) achieved R² ≥ 0.944 with non-significant lack-of-fit, confirming adequate model fit. The global optimum (pouring temperature 710°C, mold permeability 152 AFS, cooling rate 2.6°C/s, Si content 6.7 wt%) achieved a 63.5% reduction in porosity index, 38.2% improvement in surface roughness, 17.6% improvement in Vickers hardness, and 17.8% improvement in ultimate tensile strength compared to baseline.
4) Validation trials confirmed model predictions with a mean absolute error of 4.1% across all three responses, meeting the ≤5% industrial acceptance criterion. The MPOF requires only 81 experimental runs (vs. 19,683 for a full factorial), is implementable in standard statistical software, and requires no specialist computational expertise making it directly accessible to small and medium foundry enterprises. In this section, authors are advised to provide a thorough analysis of the results and make comparisons with relevant literature, not a short summary or conclusion. Any future research directions could also be stated in the discussion.
Abbreviations
MPOF | Multi-Parameter Optimization Framework |
DOE | Design of Experiments |
RSM | Response Surface Methodology |
S/N | Signal-to-Noise Ratio |
PI | Porosity Index |
HV | Vickers Hardness |
Ra | Average Surface Roughness |
AFS | American Foundry Society (Permeability Unit) |
OES | Optical Emission Spectrometry |
PCR | Percentage Contribution Ratio |
SIB | Smaller-is-Better |
LIB | Larger-is-Better |
CCD | Central Composite Design |
SDAS | Secondary Dendrite Arm Spacing |
Acknowledgments
Thanks are also extended to Pamulang University for providing the necessary facilities and support. In addition, the author is very grateful to his family and friends who have always encouraged him.
Author Contributions
Joni Arif: Conceptualization, Methodology, Investigation, Writing – original draft
Andrian Maulana: Data curation, Formal Analysis, Software, Visualization
Data Availability Statement
The data is available from the corresponding author upon reasonable request.
The data supporting the outcome of this research work has been reported in this manuscript.
Conflicts of Interest
The authors declare no conflicts of interest.
References
| [1] |
D. Kurkul, D. Gilson, J. Lancaster, and B. Muller, Metal casting Industry Overview Report. 2024.
|
| [2] |
J. Campbell, Complete Casting Handbook. 2015.
https://doi.org/10.1016/c2014-0-01548-1
|
| [3] |
O. O. Ajibola, D. T. Oloruntoba, and B. O. Adewuyi, “Effects of Moulding Sand Permeability and Pouring Temperatures on Properties of Cast 6061 Aluminium Alloy,” Hindawi Publ. Corp. Int. J. Met., vol. 2015, 2015,
http://dx.doi.org/10.1155/2015/632021
|
| [4] |
A. F. Albu and V. I. Zubov, “Optimal Control of the Solidification Process in Metal Casting,” Comput. Math. Math. Phys., vol. 48, no. 5, pp. 805–815, 2008,
https://doi.org/10.1134/S0965542508050096
|
| [5] |
D. M. Stefanescu, Science and engineering of casting solidification: Third edition. 2015.
https://doi.org/10.1007/978-3-319-15693-4
|
| [6] |
M. B. Djurdjevic and S. Manasijevic, “Improving Casting Simulation Accuracy Through Thermal Analysis of Aluminum Alloys,” MDPI, pp. 1–16, 2026,
https://doi.org/10.3390/cryst16030159
|
| [7] |
S. N. Aloni, “Optimization of Essential Parameters in Green Sand Process to Minimize Persisting Casting Defects Using Taguchi Approach,” J. Eng. Sci. Technol. Rev., vol. 12, no. 5, pp. 127–138, 2019,
https://doi.org/10.25103/jestr.125.15
|
| [8] |
P. Beeley, 2001. Foundry technology (2nd ed.). Butterworth-Heinemann,
https://doi.org/10.1016/B978-0-7506-4567-6.X5000-6
|
| [9] |
P. A. Sylajakumari and R. Ramakrishnasamy, “Taguchi Grey Relational Analysis for Multi-Response,” MDPI, pp. 1–17, 2018,
https://doi.org/10.3390/ma11091743
|
| [10] |
J. Liu, J. C. Jie, B. Peng, J. P. Qu, X. L. Wang, and T. J. Li, “Revealing the effect of Si content on the microstructure and properties of Al e Si alloy by experiments and phase-field simulation,” J. Mater. Res. Technol., 2023,
https://doi.org/10.1016/j.jmrt.2023.09.279
|
| [11] |
A. U. Patwari, S. A. Bhuiyan, K. Noman, and W. Ul Navid, Defects and remedies in casting processes: a combinatorial approach between manual and digital optimization technique for enhanced quality casting, vol. 3, no. 1. Springer International Publishing, 2024.
https://doi.org/10.1007/s44245-024-00067-2
|
| [12] |
S. Cunha, “Application of Foundry Wastes in Eco-Efficient Construction Materials : A Review,” MDPI, 2025,
https://doi.org/10.3390/app15010010
|
| [13] |
W. T. Yongfei Juan, Guoshuai Niu, Haitao Jiang, Jian Yang, “machine learning-assisted design of AL-Zn-Mg-Cu alloys with dramatically enhanced combination of mechanical strenght and plasticity,” SSRN, pp. 1–36, 2022,
http://dx.doi.org/10.2139/ssrn.4244660
|
| [14] |
S. Y. Tingli Wang, “Research of Feeding Effect of Ductile Cast Iron under Different Riser Conditions,” Metals (Basel)., no. 12, pp. 1–11, 2022,
https://doi.org/10.3390/met12030412
|
| [15] |
G. K. Sigworth, “Discussion of ‘prediction of shrinkage pore volume fraction using a dimensionless niyama criterion,’” Metall. Mater. Trans. A Phys. Metall. Mater. Sci., vol. 40, no. 13, pp. 3051–3053, 2009,
https://doi.org/10.1007/s11661-009-0056-2
|
Cite This Article
-
APA Style
Arif, J., Maulana, A. (2026). A Multi-parameter Optimization Framework for Casting Quality: Beyond Riser Geometry. American Journal of Mechanical and Materials Engineering, 10(2), 48-61. https://doi.org/10.11648/j.ajmme.20261002.12
 Copy
|
Copy
|
 Download
ACS Style
Arif, J.; Maulana, A. A Multi-parameter Optimization Framework for Casting Quality: Beyond Riser Geometry. Am. J. Mech. Mater. Eng. 2026, 10(2), 48-61. doi: 10.11648/j.ajmme.20261002.12
Copy
|
Download
AMA Style
Arif J, Maulana A. A Multi-parameter Optimization Framework for Casting Quality: Beyond Riser Geometry. Am J Mech Mater Eng. 2026;10(2):48-61. doi: 10.11648/j.ajmme.20261002.12
Copy
|
Download
-
@article{10.11648/j.ajmme.20261002.12,
  author = {Joni Arif and Andrian Maulana},
  title = {A Multi-parameter Optimization Framework for Casting Quality: Beyond Riser Geometry},
  journal = {American Journal of Mechanical and Materials Engineering},
  volume = {10},
  number = {2},
  pages = {48-61},
  doi = {10.11648/j.ajmme.20261002.12},
  url = {https://doi.org/10.11648/j.ajmme.20261002.12},
  eprint = {https://article.sciencepublishinggroup.com/pdf/10.11648.j.ajmme.20261002.12},
  abstract = {Casting defects such as shrinkage porosity, hot tearing, and misruns continue to impose significant economic burdens on foundry industries worldwide, with rejection rates for complex castings sometimes exceeding 15%. While riser geometry has traditionally been the primary lever for defect control, emerging evidence suggests that a holistic, multi-parameter approach encompassing pouring temperature, mold permeability, alloy composition, and solidification rate can substantially outperform single-variable optimization strategies. This study introduces a comprehensive Multi-Parameter Optimization Framework (MPOF) for casting quality control that integrates Taguchi design-of-experiments, finite-element solidification modeling, and response surface methodology to simultaneously optimize nine independent process variables. A total of 81 experimental runs were conducted using an aluminum–silicon alloy (A356) in green-sand molds, with porosity index, surface roughness Ra, and Vickers hardness as quality metrics. Results indicate that pouring temperature (contribution ratio: 28.3%) and mold permeability (21.7%) exerted the greatest influence on porosity formation, while alloy silicon content (19.4%) most significantly affected hardness distribution. Optimal parameter combinations achieved a porosity index reduction of 63.5% relative to baseline conditions and improved ultimate tensile strength by 18.2%. The MPOF revealed complex interaction effects between cooling rate and gating system design that had previously been masked in single-variable studies. Validation trials confirmed model predictions with a mean absolute error below 4.1%. This framework provides foundry engineers with a systematic, data-driven methodology for quality optimization that transcends the conventional focus on riser geometry alone, offering applicability to diverse alloy systems and mold configurations.},
 year = {2026}
}
Copy
|
Download
-
TY  - JOUR
T1  - A Multi-parameter Optimization Framework for Casting Quality: Beyond Riser Geometry
AU  - Joni Arif
AU  - Andrian Maulana
Y1  - 2026/06/10
PY  - 2026
N1  - https://doi.org/10.11648/j.ajmme.20261002.12
DO  - 10.11648/j.ajmme.20261002.12
T2  - American Journal of Mechanical and Materials Engineering
JF  - American Journal of Mechanical and Materials Engineering
JO  - American Journal of Mechanical and Materials Engineering
SP  - 48
EP  - 61
PB  - Science Publishing Group
SN  - 2639-9652
UR  - https://doi.org/10.11648/j.ajmme.20261002.12
AB  - Casting defects such as shrinkage porosity, hot tearing, and misruns continue to impose significant economic burdens on foundry industries worldwide, with rejection rates for complex castings sometimes exceeding 15%. While riser geometry has traditionally been the primary lever for defect control, emerging evidence suggests that a holistic, multi-parameter approach encompassing pouring temperature, mold permeability, alloy composition, and solidification rate can substantially outperform single-variable optimization strategies. This study introduces a comprehensive Multi-Parameter Optimization Framework (MPOF) for casting quality control that integrates Taguchi design-of-experiments, finite-element solidification modeling, and response surface methodology to simultaneously optimize nine independent process variables. A total of 81 experimental runs were conducted using an aluminum–silicon alloy (A356) in green-sand molds, with porosity index, surface roughness Ra, and Vickers hardness as quality metrics. Results indicate that pouring temperature (contribution ratio: 28.3%) and mold permeability (21.7%) exerted the greatest influence on porosity formation, while alloy silicon content (19.4%) most significantly affected hardness distribution. Optimal parameter combinations achieved a porosity index reduction of 63.5% relative to baseline conditions and improved ultimate tensile strength by 18.2%. The MPOF revealed complex interaction effects between cooling rate and gating system design that had previously been masked in single-variable studies. Validation trials confirmed model predictions with a mean absolute error below 4.1%. This framework provides foundry engineers with a systematic, data-driven methodology for quality optimization that transcends the conventional focus on riser geometry alone, offering applicability to diverse alloy systems and mold configurations.
VL  - 10
IS  - 2
ER  -
Copy
|
Download