Research Article | | Peer-Reviewed

Mathematical Modeling of Batch Fluidized Bed Drying of Alumina

Received: 24 January 2025     Accepted: 7 February 2025     Published: 21 February 2025
Views:       Downloads:
Abstract

Fluidized bed drying is an efficient and widely used method for drying wet powders and granular products. To optimize this drying process, several approaches for modeling, including empirical, semi-empirical, or more complex computational fluid dynamics models are used. This work aims to simulate batch fluidized bed drying processes of alumina using the multi-phase model equation. Firstly, a thermodynamic characterization of alumina was carried out using the static gravimetric method to determine sorption isotherms, enthalpy and entropy. Than, drying kinetics at different operating conditions (temperature and air flow) are investigated. Finaly, A three-phase mathematical model describing the fluidized bed dryer has been provided based on a numerical method. The system of equations (heat and mass transfer) is solved numerically by the finite element method using "COMSOL multiphasic" software. Results show that, for the sorption isothermes, the increase in temperature inducing the decrease in the equilibrium water content, and that the GAB model can describe correctly experimental isotherms. The high sorption enthalpy value (8000 kJ/mol) is an indication of the strong water-solid surface interaction in the product. The desorption entropy has a high dependence on the water content, particularly for low water contents. The maximum desorption entropy value reaches 200 kJ/mol. K at low equilibrium water contents values. Temperature is the major factor influencing drying kinetics. According to the fluidized bed drying simulation, results show the capacity of the three-phase Kunii-Levenspiel model to describe and predect the spacio-temporal distribution of water content of alumina and temperature in the fluized bed during drying The model was validated on distinct operating conditions.

Published in American Journal of Mechanics and Applications (Volume 12, Issue 1)
DOI 10.11648/j.ajma.20251201.12
Page(s) 11-21
Creative Commons

This is an Open Access article, distributed under the terms of the Creative Commons Attribution 4.0 International License (http://creativecommons.org/licenses/by/4.0/), which permits unrestricted use, distribution and reproduction in any medium or format, provided the original work is properly cited.

Copyright

Copyright © The Author(s), 2025. Published by Science Publishing Group

Keywords

Fluidized Bed Drying, Alumina, Three-Phase Mathematical Model

1. Introduction
Fluidized bed drying is indeed a highly versatile and effective method for drying powders and granular materials. The process involves forcing hot air through a bed of particles, causing them to become suspended or "fluidized," which enhances the heat and mass transfer between the drying air and the material. Fluidized bed dryers are used in many industries, including: pharmaceuticals, food processing, chemicals, agricultural products, waste management, environmental protection processes . The fluidized bed drying technique is the combination of two ideas: drying and fluidization. There have been many improvements in the design of fluidized beds to improve the economic and energy efficiency of wet granulation and dewatering. Optimization of drying from the point of view of energy consumption consists in finding the operating parameters (temperature and air speed), constant or variable during the process, which make it possible to achieve the desired water content while reducing energy consumption. The heart of the optimization therefore lies in the mathematical modeling of physical phenomena and the behavior of the product in terms of heat and mass transfer on the one hand and of thermo-physical and water behavior on the other hand during drying. The model implemented should be validated on the basis of the experimental data of the products studied. The fluidization technique consists in circulating a fluid through a layer of solid particles, with a speed sufficient to suspend each grain. Experience shows that fluidization by gases leads to the formation of bubbles in the particle bed; it appears as a boiling liquid. A fluidized bed offers a large exchange surface between the gas and the solid, a high intensity of heat transfers between the gas and the particles, and between the fluidized bed and the reactor wall, which leads to an excellent temperature uniformity in the layer and makes it easier to control this temperature by adding or removing heat. In addition, the material transfer rates between the gas and the solids are high . Alumina or aluminum oxide, with the chemical formula Al2O3, is a naturally occurring chemical compound in bauxite, in the form of hydrated alumina mixed with iron oxide. Alumina can be obtained from several precursors such as Gibbsite or Boehmite. Generally, alumina is produced by extraction from bauxite, using a chemical process called the Bayer process. Thus, alumina has three allotropic varieties (crystalline form): 1) α-Al2O3, the pure form obtained by calcination at high temperature (defines the corundum structure where the oxygen forms a compact hexagonal stack with the aluminum ions housed in the third octahedral sites). 2) β- Al2O3, is the compound Na2O3) γ- Al2O3, stable up to 1000°C and contains traces of water or hydroxyl ions. Alumina (Al2O3) is widely used in the industrial industry due to its high performance and low cost. Alumina is a good adsorbate which adsorbed water from air and we used it as a model in our study .
In the present work, the fluidized bed drying technique was used to evaluate the hydro-thermo-physical behavior of alumina. Aluminum oxides are widely used chemicals in the industry. The main use of alumina is the production of aluminum, but they are also widely used in the abrasives, ceramics industry, it can be used as an intrinsic catalyst, or as one of the elements of a multi-component catalyst. or also as a support for a metal catalyst and can also be presented as an air moisture adsorbent, for example used for petroleum refining.
The objective of this study is to optimize the drying process in terms of energy efficiency and quality of the finished product. This requires the study of particle behavior alumina during drying in a fluidized bed and the mathematical description of the heat transfer and mass transfer phenomena involved throughout the dehydration process.
2. Materials and Methods
2.1. Materials
Alumina (Al2O3) was purchased from Sigma-Aldrich. Hydrated alumina was prepared in the laboratory by adding distilled water until it has a water content of 4%.
2.2. Thermodynamic Properties
2.2.1. Moisture Desorption Isotherms Modeling
The static gravimetric method using saline solutions was used to determine isotherms. The hermetic containers are placed in an oven and the experiments are carried out at three different temperatures: 30, 40, 50°C and 5 relative humidity values. Once equilibrium is reached, the samples are weighed. Finally, the samples are placed in an oven set at 105°C to obtain their dry masses.
The alumina experimental desorption isotherms were fitted with five semi-empirical correlations. The corresponding equations include two or three parameters (Table 1). These parameters were identified by non-linear least square regression analysis, using CurvExpert 1.4 software with two statistical criteria, namely the correlation coefficient (r) and the standard error (s).
Table 1. Mathematical models for fitting the desorption isotherms of alumina.

Model

Equations

Parameters

G. A. B

XXM=C.K.aw1-K.aw.1+C-1.K.aw

C

K

Oswin

X=a.aw1-awb

a

b

Dent

aw=exp1Tβ-1TK1X1K2

K1

K2

Henderson

X=a(-ln(1-awb)

a

b

Halsey

aw=exp-bXc

b

c

2.2.2. Net Isosteric Heat of Desorption
For a given equilibrium moisture content, the desorption isostericheat wasdeterminedby applying Eq. (1), which is derived from the Clausius–Clapeyron equation to data obtained from the best fitting desorption model.
d ln(aw)d(1T)x=Qst.nR=qst-LvR(1)
where Qst,n is the net isosteric heat of desorption (J/mol), qst is the total isosteric heat of desorption (J/mol), R is the universal gas constant (8.315 J/molK), Lv is the latent heat of vaporization for pure water (J/mol) and aw is the water activity at air temperature T (K). Assuming that Qst,n is independent of temperature at a given specific equilibrium moisture content, the intergration of equation (1) gives the following equation (2) :
lnaw=-Qst.nR1T+cte(2)
The net isosteric heat of desorption Qst,n can be determined from the slope of the graph ln (aw) versus (1/T). This procedure is repeated for several equilibrium moisture content values determined by the best fit desorption model. This method allows to determine the variation of net isosteric heat (Qst,n) with moisture content.
2.2.3. Differential Entropy
The molar differential entropy of desorption (S) is associated with the forces of attraction or repulsion of water molecules to the product components and is linked with the spatial arrangement of the water–sorbent relationship. Entropy, thus, characterizes or defines the degree of order or randomness existing in the water–sorbent system, which can help interpreting processes such as dissolution, crystallization and swelling. This parameter can be calculated easily from the sorption enthalpy:
Sa=HaT(3)
2.3. Fluidized Bed Drying Experiments
Fluidized bed dryer model FGS/2000, PIGNAT, as shown in Figure 1, was used for the experiment. This fluidized bed is cylindrical, approximately 18 cm in diameter and 32 cm high, with a voltage of 230 V 50 Hz. The experiments are carried out at three air velocities (1.005 10-3, 1.185 10-3 and 1.36 10-3 Kg/s) three temperatures (30, 40 to 50°C).
Figure 1. Batch Fluidized Bed Dryer.
2.4. Theory
In the three-phase model, a bubbling bed consists of three distinct: bubble phase, cloud-wake phase and emulsion or dense solid phase.
2.4.1. Simplifying Assumptions
In order to develop a mathematical model for a fluid bed dryer, the following assumptions are made.
All the particles in the fluidized bed are identical, they all have the same physical properties.
1) the emulsion phase (gas + solid) is perfectly homogeneous, that is to say that the solid particles are perfectly mixed with the interstitial gas.
2) the emulsion phase remains in the minimum fluidization conditions and the exe of air passes the bed in the form of a bubble.
3) the gas acts on the mass and heat exchange between the bubble and the solid particles.
4) the bubble phase does not contain a solid particle consequently, the bubble phase exchanges the mass only with the gas.
When a bubble rises through the bed, its size and speed remain constant with the height of the bed while its moisture content and its temperature change are due to the exchange of mass and heat with the interstitial gas the distribution of humidity and temperature of the solid phase are uniform on the bed.
All changes in the physical properties of gas and solid particles due to temperature change are neglected except the diffusion coefficients of water.
The wall of the bed is insulated and there is no heat transfer between the wall and the phases.
2.4.2. Differential Equations
The differential equations describing the conservation of a general dependent variable, U, can be written in a generalized form according to Patankar :
ddt(ρU)+div(uρU)=div(ΓUgradU)+SU(4)
U: variable, ddtρU: Accumulation term, 𝑑𝑖𝑣(𝑢𝜌𝑈): Convection term or flow term, 𝑑𝑖𝑣 (𝛤𝑈𝑔𝑟𝑎𝑑𝑈): Diffusion term, 𝑆𝑈: Source term
The laws on interphase transport must be incorporated in the "source term", which represents the generation and dissipation of the variable U. The expressions for ΓU and SU depend on the physical meaning of the variable U. In convection drying, the moisture content and the enthalpy (temperature) of the material being dried, are special cases of the general dependent variable to be determined. At the same time, the corresponding system of different partial equations derived on the basis of the equation (4) for the fluidized bed can be written (with the symbols defined in the Nomenclature section):
The bubble phase
The bubbles in a fluidized bed are a source of inhomogeneity inside the bed. In many applications, particularly those involving rapid reaction processes, they are the control parameter for determining the overall performance of the bed.
To model the behavior of the bubble, it is necessary to divide the bed into a certain number of one-dimensional control volumes. For each control volume, different equations can be developed for the mass and energy balances of the bubble phase.
The mass balance for the bubble in the control volume can be written (Figure 2).
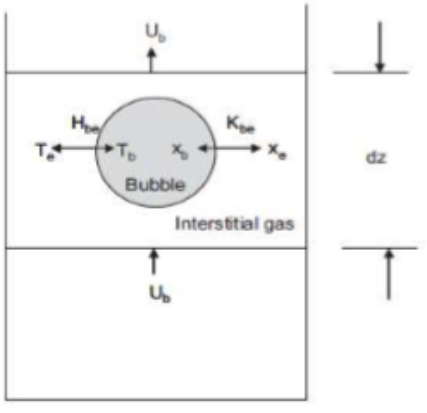
Figure 2. Mass and heat transfer between the bubbles and the interstitial gas.
The energy balance of the bubble phase is written:
dEdt=dρgCbεbUbTbdz+HebTe-Tb+CwvTe-TbρgεbKeb+(Xe-Xb)(5)
According to hypothesis 6
dTbdz=Te-TbρgCbUbHeb+CwvρgKeb+(Xe-Xb)(6)
The emulsion phase: interstitial gas
The interstitial gas has interactions with the solid phase, the bubble phase and the walls. We can take into account that the wall of the bed is insulated and there is no heat transfer between the wall and the phases. The bed is considered non-insulated and the temperature of the interstitial gas phase may change along the bed. The equation of the mass balance for the interstitial gas in the control volume can be written (Figure 3):
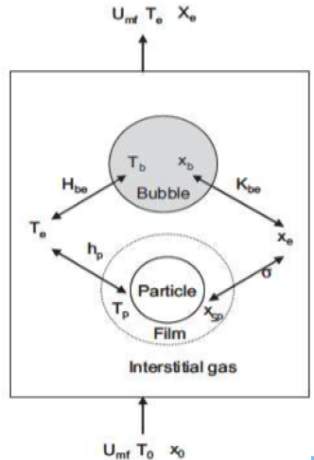
Figure 3. Mass and energy transfer for the interstitial gas with bubble and particle phases.
During a drying process, since internal heat transfer occurs much faster than internal mass transfer, the temperature is assumed to be uniform throughout an entire particle. A stagnant thin film of gas surrounds each surface of particles to resist heat and mass transfer between the particles and the gas, as shown in the figure. The temperature and the moisture content of the gas in the film are assumed to be in thermodynamic equilibrium with those of the Particulate environment, which means that the temperatures of the gas and the particles are equal and the moisture contents of the gas and particles have established the equilibrium relationship called the sorption isotherm. The value of the moisture content of the gas in the film depends on the temperature and the average moisture content of the particle.
The gas mass balance equation is:
ρgUmfH(Xe-Xb)=Kp(Xsp-Xe)6εpdp+ρgεbKeb(X~b-Xe)(7)
the energy balance can be simplified for
ρgCeUmfHTe-Tb=Tp-Te6εpdphp+ρgKpXsp-XeCwv+εbKeb(T-Te)(8)
The emulsion phase: solid particles
Drying solids can take place in two different modes, namely the constant rate and the sink rate. The existence of each mode depends on the moisture content of the solids and other conditions of solid medium and drying. In the constant drying rate, the use of diffusion type equations for predicting the temperature and moisture content of the solid is not necessary since there is sufficient free moisture in the solid. Usually a globule model can be used to analyze the moisture content of a particle. This means that the humidity diffusion coefficient is close to infinity and that the drying process is not controlled by diffusion. The mass equation in this case can be written as:
ρgdXpdt=6dpKpXsp-Xe(9)
Finally, the energy equation is given as:
ρgCpdTpdt=6dphpTe-Tp-KphfgXsp-Xe(10)
2.4.3. Configuration of Models
The equations of the physical model have been solved by the element method. A commercial solver (COMSOL Multiphysics), working with the finite element method and taking into account the requirements of our model, is used for the numerical resolution of our problem. The validation of the calculation code is carried out by comparing the kinetics (temporal evolution of the average water content of the product) from experience with those of numerical simulation.
3. Results and Discussion
3.1. Sorption Isotherms
Figure 4 shows the water vapor sorption’s isotherms on alumina obtained at different temperatures (30, 40 and 50°C). We can notice that: - The sorption isotherms take on a sigmoid type II appearance according to the classification of B. E. T. An increase in temperature is accompanied by a decrease in the water content for a constant water activity, for high temperatures the excitation state of the molecules is higher, resulting in a decrease in the forces of attraction of water molecules between them, approaching a relative humidity equal to unity.
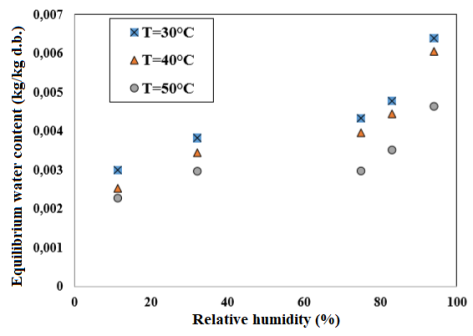
Figure 4. Desorption isotherms at different temperatures.
The equilibrium isotherms increase with the activity of water for a fixed temperature.
Smoothing of isotherms
Seven models presented in Table 1 were used to smooth the alumina sorption isotherms. Among the models tested, it is the GAB model which ensures the best fit of the experimental isotherms of alumina. Indeed, they have the lowest standard error values S: S = 0.04 to 0.05 10-2 and the highest determination coefficients 97%. The value of the monolayer moisture content (Xm) obtained by the GAB model is an important parameter. It is considered as the sorption capacity of the adsorbent and as an indicator of the polar sites available for the binding of water vapor . As with the equilibrium moisture content, the monolayer moisture content of alumina decreases with increasing temperature. As shown in the previous table, the values of Xm, which indicate the sorption capacities of the adsorbents, are lower at higher temperatures. From isotherms, it is possible to determine several thermodynamic properties: the isosteric heat of sorption which is a measure of the degree of binding of water and the amount of energy to be supplied to release this water, the variation of entropy and enthalpy.
3.2. Enthalpy and Entropy of Sorption
When water vapor is adsorbed on a surface, a quantity of heat (the heat of adsorption) is released. Likewise, when the adsorbed water vapor is desorbed, an amount of heat is absorbed (the heat of desorption). It corresponds to the energy which must be added to the adsorbed gas to break the intermolecular force. The desorption and adsorption heats indicate the binding energy or intermolecular force between the water vapor molecules and the surface of the adsorbent (wet product). The heat of adsorption, which is an indicator of the type of adsorption (chemical or physical), can be measured by calorimetry, or determined indirectly, using isotherms measured at different temperatures. In our case we have a physical adsorption, or physisorption, which does not involve any chemical reaction between the adsorbent and the adsorbate. It is exothermic (∆G <0) and occurs without modification of the molecular structure, which then makes it reversible. The release of heat produced makes it possible to go up to the adsorption enthalpies which are connected to the surface state of the adsorbents. The isosteric method consists in calculating the enthalpies of adsorption from the `knowledge of the isotherms of adsorption at different temperatures . It is necessary for this to assume that the measurements of adsorption isotherms do correspond to an equilibrium state of adsorption and that the system is reversible from the thermodynamic point of view. If these hypotheses are satisfied, the determination of the enthalpy of adsorption is then based on the following relationship with the Clausis Clapeyron equation . The slope of the isosteres makes it possible to determine, for each equilibrium water content, the corresponding isosteric heat. The variation in entropy (ΔS) is linked to the number of sorption sites available at a specific energy level. According to Everett , the relationship between enthalpy and entropy of adsorption is given by the equation using pure water as a reference and supposing that the transformation of molecules from the liquid state to the adsorbed state is isothermal.
The enthalpy of desorption of water vapor on alumina decreases with increasing equilibrium water content (Figure 5). The high enthalpy values, for low water contents, indicate a strong bond of water in the product to be dried as an indication of the strong water-solid surface interaction in the product. The maximum enthalpy of desorption is around 8000 kJ / mol.
The evolution of entropy of desorption as a function of the equilibrium water content, shown in Figure 6 is similar to that of the enthalpy of desorption. It has a high dependence on the water content, particularly for low water contents. The maximum entropy of desorption reaches the values of 200 kJ/mol. K at zero equilibrium water contents.
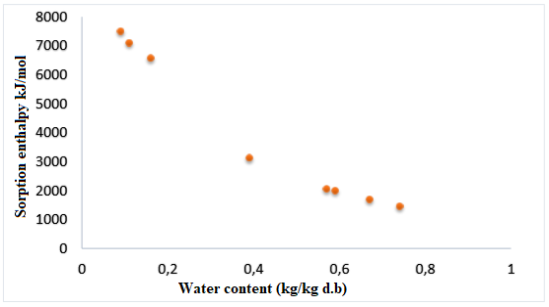
Figure 5. Variation of the enthalpy of desorption as a function of the water content.
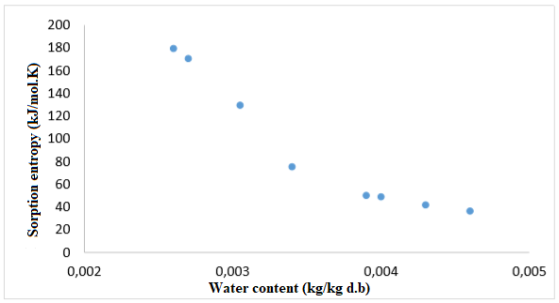
Figure 6. Variation of the desorption entropy as a function of the water content.
During a drying operation, the energy input is used to increase the temperature of the product and to evaporate the water contained in it. This contribution can be generated by drying with a hot gas, by contact with a heated surface or by radiation. Water migrates from the interior to the exterior of the product, where it is evacuated by natural or forced convection to the ambient environment. Several theories and models have been developed to account for the drying kinetics and to understand the physical laws that control transfers. In this work, fluid bed drying was used to dehydrate alumina.
3.3. Drying Experiments
3.3.1. Fluidization Regimes
For a given bed of particles, the state of the suspension changes as a function of the fluidization speed and the nature of the solid. By gradually increasing the fluidization flow (in practice we will use the notion of fluidization speed), we observe the following phenomena (Figure 7). 1) At very low gas speeds, the particles are stationary. No fluidization occurs. 2) At a speed Umf which we will call minimum fluidization speed. The suspension remains homogeneous and no bubble appears under this condition the particles generally behave like a fluid, hence the term "fluidized bed".
The minimum fluidization speed is determined experimentally by the standardized method proposed by Richardson et al. . This author defined the minimum speed as the abscissa of the point of intersection of the pressure drop level and the curve representing the evolution of the pressure drop across the fixed bed obtained at decreasing gas speed. At a speed slightly higher than Umf bubbles appear, increasing the fluidization speed and over a relatively wide operating range, the bed remains fluidized. In this regime, the bubbles have a regular shape, often spherical but with a lower cap filled with solid particles (drag). This operating regime is called bubbling fluidization and corresponds to that which is most often used. For very high gas speeds, the solid particles are elutriated, the bed enters a driven bed regime.
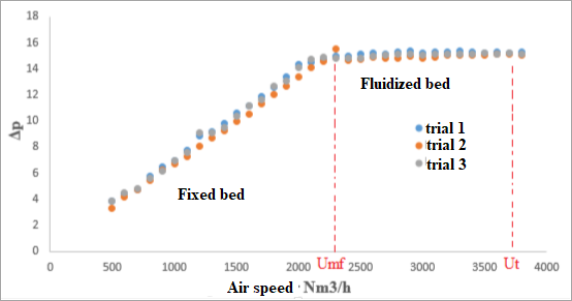
Figure 7. Evolution of the pressure drop of a bed of particles as a function of the speed.
3.3.2. Alumina Drying Kinetics
Figure 8 shows the evolution of the water content X of alumina as a function of time t, for three values of air temperature (30, 40 and 50°C). The tests were carried out at an air flow of 1.36 10-3 Kg / s and an initial water content of 4%. It emerges from the appearance of these curves that for the same drying air flow, the water content of the product at a given time of drying decreases when the temperature of the drying air increases. The water content of the alumina sample at the temperature of 30°C reaches 1% after 115 minutes of drying, while it reaches the same water content after only 75 minutes for the temperature 50°C. The shape of the drying speed curve (Figure 9) shows that drying takes place in two phases: Drying goes through a short transient step at increasing speed followed by a phase at constant speed, ending with a phase of slowdown triggered when the surface is no longer supplied with free water. This result corroborates the results obtained by certain studies carried out on the kinetics of drying of fixed bed alumina .
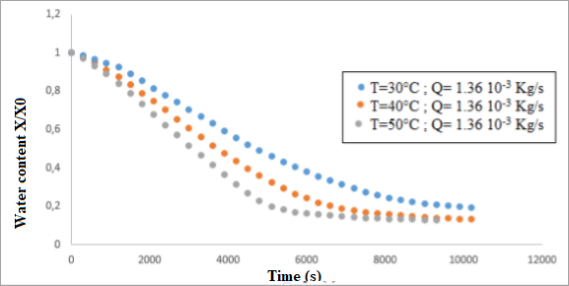
Figure 8. Evolution of the alumina water content versus time at different temperatures of the drying air.
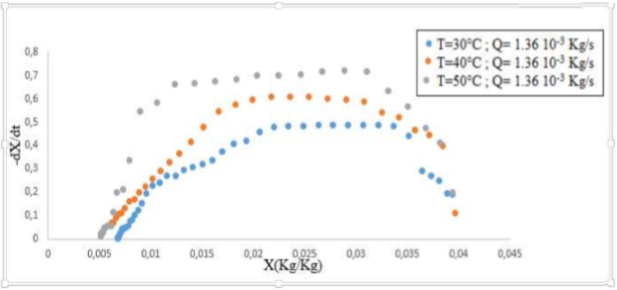
Figure 9. Evolution of the drying speed of alumina at different temperatures of the drying air.
Figures 8 and 9 show a significant impact of temperature on the drying kinetics of alumina. The drying time decreased with increasing drying temperature.
In what follows, we will change the drying air flow, while keeping the temperature constant. Figure 10 shows the evolution of the water content X versus time t, for three values of air flow. The tests were carried out at a temperature of 50°C and an initial water content of 4%. We note that for the same drying air temperature, an increase in the drying air flow favors the acceleration of the drying process: The water content of the product at a given time of drying decreases slightly when the air speed increases. This results in a small increase in the drying air flow when the flow increases (Figure 11). The shape of Figure 11 generally shows two phases: A warm-up period where the temperature of the product is lower than that of the drying air, a relatively short constant speed phase where the water is discharged at constant flow and phase at speed decreasing where the different internal resistances of the material to heat and material transfers control the drying speed.
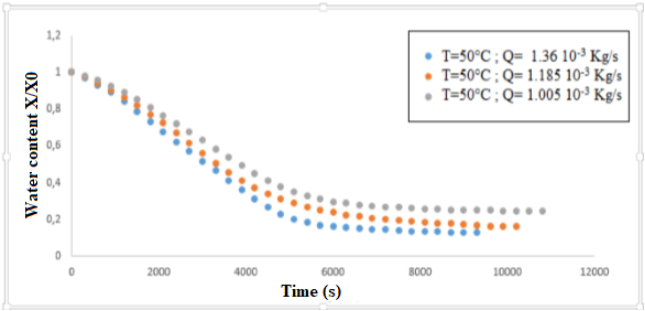
Figure 10. Evolution of the water content as a function of time at different air flows.
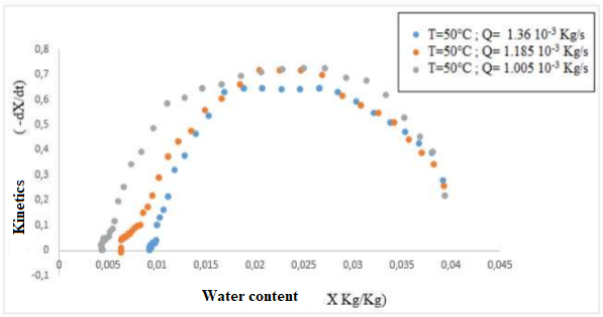
Figure 11. Evolution of the drying speed of alumina at different flow rates of the drying air.
3.4. Modelling
The system of equations describing fluidized bed drying is solved numerically by the finite element method using the "COMSOL multiphysics" software. In what follows, the results presented are those of the condition (T=50°C, initial water content=4% and Q=1.363 10-3 kg/s).
3.4.1. Water Content Simulation
Numerical modeling allows us to obtain the spatiotemporal distribution of each state variable (temperature and water content) in the drying column. These profiles are very interesting to better understand the physical phenomena that occur during the process. The distribution of the water content in the dryer at different drying times is presented in Figure 12 We note the presence of a large internal water content gradient and that this gradient decreases towards the end of drying.
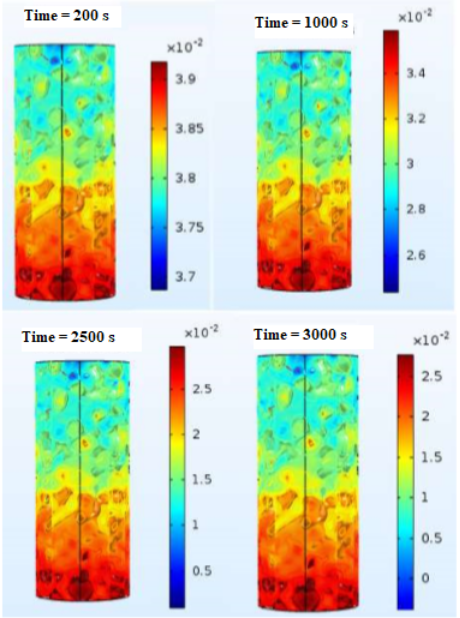
Figure 12. Spatio-temporal distribution of water content at t=200 s, t=1000 s, t=2500 s and t=3000 s.
3.4.2. Validation Against Drying Experiments
The simulated evolution of the average water content of the product, as a function of time is presented in Figure 13. Figure 14 shows the experimental and theoretical drying kinetics of fluid bed drying of alumina (drying temperature equal to 50°C). Note that the numerical and experimental results are in agreement for a large part of the drying time. The differences between the experimental curves and those resulting from the simulation are due can be attributed to the degree of validity of the thermo-physical properties taken from the literature.
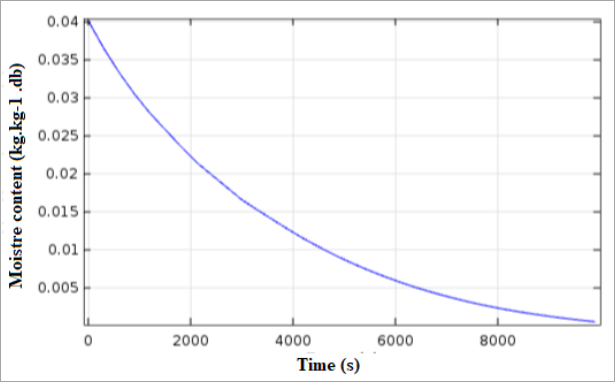
Figure 13. The simulated average water content.
Figure 14. Comparison between simulated and experimental average water contents.
3.4.3. Temperature Simulation
For temperature evolution Figure 15 shows the simulated temperature profile.
Figure 15. Evolution of the temperature.
The temperature rises due to the drop in mass flow at the surface and the medium reaches a temperature close to that of the drying environment. Note that the temperature distribution is small, some numerical difficulties have been encountered.
4. Conclusions
The main objective of this work was to study the behavior of alumina during drying in a fluidized bed through experimentation and numerical modeling with a view to overall optimization of the process by reducing the energy cost of drying and the control the quality of the finished product.
Experimental results show that: 1) The sorption isotherm presents sigmoid curves of type II. The increase in temperature induces a decrease in the equilibrium water content. The GAB model can correctly describe the appearance of isotherms. The enthalpy and entropy of adsorption increase with decreasing water content. 2) Studies of the alumina drying kinetics were carried out under different conditions. The variation in the drying speed of these products generally allows two drying phases to be viewed: a preheating period, a constant phase and a phase at decreasing speed. The influence of air parameters (temperature and flow) on the drying rate was studied and allowed to determine that the influence of the drying air flow on the drying kinetics is less important compared to that of the temperature.
To describe the heat and mass transfer in the gas and particle phases, a three-phase Kunii-Levenspiel model, representing a dilute phase, an interstitial gas phase and a solid phase, is used. The results obtained were generally acceptable, but some numerical difficulties were encountered.
Abbreviations

Cg

Mass Thermal Capacity of the Drying Gas (J kg-1 K-1)

Cp

Mass Thermal Capacity of Dry Particles (J kg-1 K-1)

Cw

Mass Thermal Capacity of Water in Liquid State (J kg- 1 K-1)

Cwv

Mass Thermal Capacity of Gaseous Water (J kg-1 K-1)

dp

Particle Diameter (m)

Db0

Minimum Bubble Diameter (m)

dbm

Maximum Bubble Diameter (m)

db

Bubble Diameter (m)

g

Gravitational Acceleration (m s-2)

H

Height of the Expanded Drying Bed(m)

hp

Heat Transfer Coefficient Between the Drying Gas and the Solid Particles (J s- 1 m-3 K-1)

Hbc

Volume Coefficient of Heat Transfer Between Bubbles and Cloud Regions Based on the Volume of Bubbles (J s-1 m-3 K-1)

Hbe

Volume Coefficient of Heat Transfer Between Bubbles and Emulsion Based on Volume Bubbles (J s-1 m-3 K-1)

Hce

Volume Coefficient of Heat Transfer Between the Cloud-wake Regions and the Emulsion Based on the Volume of the Bubbles (J s-1 m-3 K-1)

Hmf

Bed Height at Minimum Fluidization Conditions (m)

kp

Evaporation Coefficient (Kg m-2 s-1)

kg

Thermal Conductivity of the Drying Gas on Intake (Wm-1K-1)

Kbc

Gas Exchange Coefficient Between Bubbles and Cloud-wake Regions Based on Bubble Volume (s-1)

Kbe

Gas Exchange Coefficient Between Bubbles and Emulsion Based on Bubble Volume (s-1)

Kce

Exchange Coefficient Gas Between the Regions of Cloud-wake and the Emulsion Based on the Volume of Bubbles (s-1)

Psat

Saturation Pressure (Pa)

Pr

Number of Prandtl

R

Specific Constant of Perfect Gases of Water Vapor (J kg -1 K-1)

Re

Reynolds Number for a Compact Bed

T

Temperature (K)

t

Time (s)

Ubr

Linear Speed of a Single Bubble (m s-1)

Ub

Surface Speed of the Gas in the Bubble Phase (m s-1)

Umf

Surface Velocity of the Gas at Minimum Fluidization (m s-1)

X

Water Content

Xeq

Equilibrium Water Content

Xsp

Water Content of the Gas at the Particle Surface

z

Elevation (m)

µg

Dynamic Viscosity of the Drying Gas (kg m-1 s- 1)

ρg

Density of the Gas (kg m-3)

ρp

Density of a Dry Particle (kg m-3)

εmf

Porosity at Minimum Fluidization Conditions

εb

Bubble Porosity

εp

Volume Fraction of Particle

𝜆g

Thermal Gas Conductivity (Wm-1 K-1)

0

Inlet Gas

b

Bubble Phase

e

Emulsion Phase: Interstitial Gas

p

Emulsion Phase: Solid Particles

Author Contributions
Touil Amira: Conceptualization, Data curation, Investigation, Methodology, Project administration, Software, Supervision, Validation, Writing – original draft, Writing – review & editing
Gritli Souhir: Formal Analysis, Investigation, Resources, Software
Taieb Ahmed: Formal Analysis, Investigation, Visualization
Conflicts of Interest
The authors declare no conflicts of interest.
References
[1] Geldart, D. Types of gas fluidization, Powder Technology 1973, 7, 5, 285-292.
[2] Shakourzadeh, K. Techniques de fluidisation, 2002, 1-20.
[3] Kunii et Levenspiel. Fluidization Engineering. J. Wiley & Sons 1969.
[4] Byung-Nam, K., Keijiro, H., Koji M., Hidehiro, Y. Effects of heating rate on microstructure and transparency of spark-plasma-sintered alumina, Journal of the European Ceramic Society 2009, 29, 323–327.
[5] Anderson, R, B. Modifications of the Brunner. Emmet and Teller equations. Journal of the American Chemical Society 1946, 68, 651-658.
[6] Oswin, C. R. The kinetics of packing life III. The isotherm. Journal Chemical Indian 1946, 419-423.
[7] Dent, R. W. A sorption theory for gas mixtures. Polym. Eng. Sci 1980, 20, 286–289.
[8] Henderson, S. M. A basic concept of equilibrium moisture. Agriculture Engineering 1952, 33, 29-32.
[9] Halsey, G. Physical adsorption on nonuniform surfaces. Journal Chemical and physics 1948, 931-937.
[10] García-Pérez J. V., Carcel J. A., García-Alvarado M. A., Mulet A. Garcia-Perez et al., Simulation of grape stalk deep bed drying. Journal of Food Engineering, 90, 2, 2009, pp 308-314.
[11] Correia, R., Paulo, B. B., Prata, A. S., Ferreira, A. D., Fluid dynamics performance of phase change material particles in a Wurster spout–fluid bed Particuology, 42, 2019, pp 163-175.
[12] Patankar, S. V. Numerical Heat Transfer and Fluid Flow, Hemisphere P. C, New York 1980.
[13] Dunstan, E. R., Chung, D. S., Hdges, T. O. Adsorption and desorption of water vapor by cereal grains and their products. Part II: Development of the general isotherm equation. Trans. ASAE, 1967, 10, 552-554.
[14] Gravelle, P. C. Methods for the determination of heats of adsorption. Journal of Thermal Analysis 1978, 14, 53-77.
[15] Keey, R. B. Introduction to Industrial Drying Operations, 1st ed. Pergamon Press, New York, 1978.
[16] Everett, D. H. The thermodynamics of adsorption. Part II. Thermodynamics of monolayers on solids. Trans; Faraday Soc 1950, 46, 941- 957.
[17] Richardson, G. B. Planning versus competition. Soviet Studies, 1971, 22(3), 433–446.
[18] Wang, Z. H., Chen, G. Heat and mass transfer in fixed-bed drying, Chemical EngineeringScience, 54, 4233-4243, 1999.
Cite This Article
  • APA Style

    Amira, T., Souhir, G., Ahmed, T. (2025). Mathematical Modeling of Batch Fluidized Bed Drying of Alumina. American Journal of Mechanics and Applications, 12(1), 11-21. https://doi.org/10.11648/j.ajma.20251201.12

    Copy | Download

    ACS Style

    Amira, T.; Souhir, G.; Ahmed, T. Mathematical Modeling of Batch Fluidized Bed Drying of Alumina. Am. J. Mech. Appl. 2025, 12(1), 11-21. doi: 10.11648/j.ajma.20251201.12

    Copy | Download

    AMA Style

    Amira T, Souhir G, Ahmed T. Mathematical Modeling of Batch Fluidized Bed Drying of Alumina. Am J Mech Appl. 2025;12(1):11-21. doi: 10.11648/j.ajma.20251201.12

    Copy | Download

  • @article{10.11648/j.ajma.20251201.12,
      author = {Touil Amira and Gritli Souhir and Taieb Ahmed},
      title = {Mathematical Modeling of Batch Fluidized Bed Drying of Alumina
    },
      journal = {American Journal of Mechanics and Applications},
      volume = {12},
      number = {1},
      pages = {11-21},
      doi = {10.11648/j.ajma.20251201.12},
      url = {https://doi.org/10.11648/j.ajma.20251201.12},
      eprint = {https://article.sciencepublishinggroup.com/pdf/10.11648.j.ajma.20251201.12},
      abstract = {Fluidized bed drying is an efficient and widely used method for drying wet powders and granular products. To optimize this drying process, several approaches for modeling, including empirical, semi-empirical, or more complex computational fluid dynamics models are used. This work aims to simulate batch fluidized bed drying processes of alumina using the multi-phase model equation. Firstly, a thermodynamic characterization of alumina was carried out using the static gravimetric method to determine sorption isotherms, enthalpy and entropy. Than, drying kinetics at different operating conditions (temperature and air flow) are investigated. Finaly, A three-phase mathematical model describing the fluidized bed dryer has been provided based on a numerical method. The system of equations (heat and mass transfer) is solved numerically by the finite element method using "COMSOL multiphasic" software. Results show that, for the sorption isothermes, the increase in temperature inducing the decrease in the equilibrium water content, and that the GAB model can describe correctly experimental isotherms. The high sorption enthalpy value (8000 kJ/mol) is an indication of the strong water-solid surface interaction in the product. The desorption entropy has a high dependence on the water content, particularly for low water contents. The maximum desorption entropy value reaches 200 kJ/mol. K at low equilibrium water contents values. Temperature is the major factor influencing drying kinetics. According to the fluidized bed drying simulation, results show the capacity of the three-phase Kunii-Levenspiel model to describe and predect the spacio-temporal distribution of water content of alumina and temperature in the fluized bed during drying The model was validated on distinct operating conditions.
    },
     year = {2025}
    }
    

    Copy | Download

  • TY  - JOUR
    T1  - Mathematical Modeling of Batch Fluidized Bed Drying of Alumina
    
    AU  - Touil Amira
    AU  - Gritli Souhir
    AU  - Taieb Ahmed
    Y1  - 2025/02/21
    PY  - 2025
    N1  - https://doi.org/10.11648/j.ajma.20251201.12
    DO  - 10.11648/j.ajma.20251201.12
    T2  - American Journal of Mechanics and Applications
    JF  - American Journal of Mechanics and Applications
    JO  - American Journal of Mechanics and Applications
    SP  - 11
    EP  - 21
    PB  - Science Publishing Group
    SN  - 2376-6131
    UR  - https://doi.org/10.11648/j.ajma.20251201.12
    AB  - Fluidized bed drying is an efficient and widely used method for drying wet powders and granular products. To optimize this drying process, several approaches for modeling, including empirical, semi-empirical, or more complex computational fluid dynamics models are used. This work aims to simulate batch fluidized bed drying processes of alumina using the multi-phase model equation. Firstly, a thermodynamic characterization of alumina was carried out using the static gravimetric method to determine sorption isotherms, enthalpy and entropy. Than, drying kinetics at different operating conditions (temperature and air flow) are investigated. Finaly, A three-phase mathematical model describing the fluidized bed dryer has been provided based on a numerical method. The system of equations (heat and mass transfer) is solved numerically by the finite element method using "COMSOL multiphasic" software. Results show that, for the sorption isothermes, the increase in temperature inducing the decrease in the equilibrium water content, and that the GAB model can describe correctly experimental isotherms. The high sorption enthalpy value (8000 kJ/mol) is an indication of the strong water-solid surface interaction in the product. The desorption entropy has a high dependence on the water content, particularly for low water contents. The maximum desorption entropy value reaches 200 kJ/mol. K at low equilibrium water contents values. Temperature is the major factor influencing drying kinetics. According to the fluidized bed drying simulation, results show the capacity of the three-phase Kunii-Levenspiel model to describe and predect the spacio-temporal distribution of water content of alumina and temperature in the fluized bed during drying The model was validated on distinct operating conditions.
    
    VL  - 12
    IS  - 1
    ER  - 

    Copy | Download

Author Information
  • Research Laboratory for Sciences and Technologies of Environment, High Institute of Sciences and Technologies of Environment of Borj Cedria, University of Carthage, Carthage, Tunisia

  • Research Laboratory for Sciences and Technologies of Environment, High Institute of Sciences and Technologies of Environment of Borj Cedria, University of Carthage, Carthage, Tunisia

  • Thermal and Thermodynamic Research Laboratory of Industrial Processes, National Engineering School of Monastir, University of Monastir, Monastir, Tunisia