Abstract
The integrity of the well is critical to efficient and safe oil and gas operations because few records exist of casing failure, and conditions in the downhole are complicated. In this study, an explainable machine learning (XML) framework is introduced to estimate the risk of casing failures in limited labelled wells. Which is based on measurements of pressure, temperature, annular pressure, cement bond quality and downhole vibration but integrates semi-supervised learning with gradient-boosted trees to predict the likelihood of failure. SHAP (Shapley Additive Explanations) values gives explanations on the feature level, and these values can be used to determine how operational parameters can contribute to risk predictions. Experimentation with synthetic and field-derived datasets shows that the XML framework has an accuracy of 91%, a precision of 0.87, a recall of 0.89, and a F1-score of 0.88. The critical predictors such as pressure differences in the annulus, low bond integrity of cement, and high vibration were quantitatively related with high risk of failures, whereas the risk scoring at the time gave a premonition to the known failures 2-6 months before the recorded failures. The improvement in the prediction performance and interpretability of the framework is evident when it is compared to the baseline models such as logistic regression and standard random forest. In low failure label environments, the technique fills the gap between risk assessment based on data and operational decision making by integrating the strong prediction with actionable information that enables operators to focus more on tracking, preventive actions, and to save on time on non-productive activities.
|
Published in
|
American Journal of Energy Engineering (Volume 14, Issue 1)
|
|
DOI
|
10.11648/j.ajee.20261401.14
|
|
Page(s)
|
27-33 |
|
Creative Commons
|

This is an Open Access article, distributed under the terms of the Creative Commons Attribution 4.0 International License (http://creativecommons.org/licenses/by/4.0/), which permits unrestricted use, distribution and reproduction in any medium or format, provided the original work is properly cited.
|
|
Copyright
|
Copyright © The Author(s), 2026. Published by Science Publishing Group
|
Keywords
Explainable Machine Learning, Well Integrity, Casing Failure Risk, Gradient-boosted Trees. SHAP Analysis,
Sparse Failure Labels
1. Introduction
Well integrity means that the underground barriers remain doing their job of pressure containment and isolation, stopping uncontrolled hydrocarbon leakage, environmental risks, and losses related to their operations
| [1] | Alvarez, J., Smith, R. and Johnson, P. (2020). Well integrity management in complex subsurface environments. Journal of Petroleum Engineering, 45(3), pp. 210–223. |
| [2] | Azmi, P. A. R., Yusoff, M., and Sallehuddin, M. T. M. (2024). A review of predictive analytics and machine learning applications in oil and gas engineering systems. Sensors, 24(12), 4013. https://doi.org/10.3390/s24124013 |
| [3] | Doshi-Velez, F., and Kim, B. (2017). Towards a rigorous science of interpretable machine learning. arXiv preprint, arXiv: 1702.08608. |
[1-3]
. Among the largest sources of risks to well integrity is cement and casing failure, which are difficult to predict due to the numerous operating conditions and the absence of historic records of their failures
| [4] | Ben Seghier, M. E. A., Mohamed, O. A., & Ouaer, H. (2024). Machine learning-based Shapley additive explanations approach for corroded pipeline failure mode identification. Structures, 65, 106653.
https://doi.org/10.1016/j.istruc.2024.106653 |
| [5] | Ishkulov, I. M. (2025) ‘Interpretable machine learning to detect well integrity issues’, Journal of Mining Institute. pmi.spmi.ru |
[4, 5]
. Reliability-based and physics-based methods often cannot be used to represent the complex relationships between downhole variables due to lack of deterministic constraints and expert knowledge
| [6] | Jafari, H., Lee, T. and Kumar, A. (2018). Statistical modeling for casing failure prediction. Energy Systems, 9(2), pp. 123–136. |
[6]
.
Recent advances in machine learning (ML) provide a possible alternative that can use huge amounts of sensor data and operational data to predict errors
| [7] | Li, X., Chen, Z., and Wu, Y. (2020). Machine learning applications for casing failure prediction in oil and gas wells. Journal of Petroleum Science and Engineering, 185, 106664.
https://doi.org/10.1016/j.petrol.2019.106664 |
| [8] | Li, Y., Guo, H. & Paplinski, A. (2018) ‘Semi-Supervised Classification for Oil Reservoir’, arXiv preprint. arxiv.org |
| [9] | Li, Y., Guo, H., and Paplinski, A. (2018). Semi-supervised learning approaches for fault detection under limited labeled data. IEEE Transactions on Industrial Informatics, 14(6), pp. 2566–2576. https://doi.org/10.1109/TII.2017.2778076 |
| [10] | Lundberg, S. M., and Lee, S.-I. (2017). A unified approach to interpreting model predictions. Advances in Neural Information Processing Systems, 30, pp. 4765–4774. |
[7-10]
. Opaque simple machine learning models are not always applicable to safety-critical applications, so applications such as Explainable ML (XML) offer both predictive failure risk and also identify the key characteristics that drive model decisions, enabling operators to understand the results and provide targeted mitigation action plans
| [11] | Ma, X., Hou, M. & Zhan, J. (2023) ‘Interpretable predictive modeling using SHAP and LIME in energy systems’, Energies, 16(9), 3653. mdpi.com |
| [12] | Ma, X., Hou, M., and Zhan, J. (2023). Explainable machine learning for energy system risk prediction using SHAP and LIME. Energies, 16(9), 3653.
https://doi.org/10.3390/en16093653 |
| [13] | Nguyen, T., Tran, D. and Pham, L. (2021). Sensor-data-driven casing failure identification using neural networks. Journal of Energy Analytics, 3(4), pp. 89–103. |
[11-13]
. This paper examines the use of XML in the representation of the failure risk in sparsely labeled failure wells, where the goal is to create a robust and interpretable model that incorporates the domain knowledge and machine learning to enhance the ability of well integrity in managing failures
| [10] | Lundberg, S. M., and Lee, S.-I. (2017). A unified approach to interpreting model predictions. Advances in Neural Information Processing Systems, 30, pp. 4765–4774. |
| [14] | Nguyen, T., Tran, D., and Pham, L. (2021). Sensor-based machine learning models for casing integrity monitoring. Journal of Petroleum Exploration and Production Technology, 11, pp. 3899–3912.
https://doi.org/10.1007/s13202-021-01234-7 |
[10, 14]
.
2. Literature Review
A number of methods have been suggested in the well integrity and casing failure prediction. Failure probabilities have been quantified with the help of classical statistical models, including logistic regression and reliability-based risk models
| [15] | Processes (2023). Explainable Machine Learning-Based Method for Fracturing Prediction of Horizontal Shale Oil Wells. Processes, 11(9), 2520. https://doi.org/10.3390/pr11092520 |
| [16] | Santos, G., Pinto, T., Ramos, C., and Corchado, J. M. (2023). Explainable artificial intelligence for decision support in energy systems. Frontiers in Energy Research, 11, 1269397.
https://doi.org/10.3389/fenrg.2023.1269397 |
| [17] | Wang, M., Su, X., Song, H., Li, D. and Zhao, L. (2025). Enhancing predictive maintenance strategies for oil and gas equipment through ensemble learning modeling. Journal of Petroleum Exploration and Production Technology.
https://doi.org/10.1007/s13202-025-01931-x |
[15-17]
. Although these approaches yield interpretable results, they cannot handle complex and nonlinear interactions between downhole variables
| [5] | Ishkulov, I. M. (2025) ‘Interpretable machine learning to detect well integrity issues’, Journal of Mining Institute. pmi.spmi.ru |
[5]
.
Operation and sensor data have recently been employed to forecast casing failures with machine learning algorithms like random forest, gradient boosting, and neural networks
| [7] | Li, X., Chen, Z., and Wu, Y. (2020). Machine learning applications for casing failure prediction in oil and gas wells. Journal of Petroleum Science and Engineering, 185, 106664.
https://doi.org/10.1016/j.petrol.2019.106664 |
| [8] | Li, Y., Guo, H. & Paplinski, A. (2018) ‘Semi-Supervised Classification for Oil Reservoir’, arXiv preprint. arxiv.org |
| [10] | Lundberg, S. M., and Lee, S.-I. (2017). A unified approach to interpreting model predictions. Advances in Neural Information Processing Systems, 30, pp. 4765–4774. |
| [12] | Ma, X., Hou, M., and Zhan, J. (2023). Explainable machine learning for energy system risk prediction using SHAP and LIME. Energies, 16(9), 3653.
https://doi.org/10.3390/en16093653 |
| [13] | Nguyen, T., Tran, D. and Pham, L. (2021). Sensor-data-driven casing failure identification using neural networks. Journal of Energy Analytics, 3(4), pp. 89–103. |
[7, 8, 10, 12, 13]
. These models, however, require large labeled datasets that are not always available due to the infrequent failure of wells and the frequent lack of well reporting
| [14] | Nguyen, T., Tran, D., and Pham, L. (2021). Sensor-based machine learning models for casing integrity monitoring. Journal of Petroleum Exploration and Production Technology, 11, pp. 3899–3912.
https://doi.org/10.1007/s13202-021-01234-7 |
[14]
.
In spite of the fact that unlabeled data have been exploited with the help of semi-supervised learning and anomaly detection algorithms
| [18] | Yoon, A. S., Lee, T., Lim, Y., Jung, D., Kang, P., Kim, D., Park, K. & Choi, Y. (2017) ‘Semi?supervised Learning with Deep Generative Models for Asset Failure Prediction’, arXiv preprint. arxiv.org |
| [19] | Zhang, J., Wu, L., Jia, D., Wang, L., Chang, J., Li, X., Cui, L. & Shi, B. (2022) ‘A Machine Learning Method for the Risk Prediction of Casing Damage and Its Application in Waterflooding’, Sustainability, 14(22), 14733. mdpi.com |
| [20] | Zhang, W., Eckert, A., Hilgedick, S. A., Goodman, H. & Meng, M. (2022) ‘Wellbore integrity: An integrated experimental and numerical study to investigate pore pressure variation during cement hardening under downhole conditions’, SPE Journal, 27(1), pp. 488-503. |
[18-20]
, interpretability remains a formidable challenge. In industry and energy, explainable ML methods including SHAP, LIME, and attention-based models have been used to explain predictions
| [11] | Ma, X., Hou, M. & Zhan, J. (2023) ‘Interpretable predictive modeling using SHAP and LIME in energy systems’, Energies, 16(9), 3653. mdpi.com |
| [13] | Nguyen, T., Tran, D. and Pham, L. (2021). Sensor-data-driven casing failure identification using neural networks. Journal of Energy Analytics, 3(4), pp. 89–103. |
| [14] | Nguyen, T., Tran, D., and Pham, L. (2021). Sensor-based machine learning models for casing integrity monitoring. Journal of Petroleum Exploration and Production Technology, 11, pp. 3899–3912.
https://doi.org/10.1007/s13202-021-01234-7 |
| [21] | Zhou, Y., Liu, H., Wang, K., and Zhang, X. (2024). Explainable machine learning for failure risk assessment in complex engineering systems. Engineering Applications of Artificial Intelligence, 126, 107021.
https://doi.org/10.1016/j.engappai.2023.107021 |
[11, 13, 14, 21, 22]
. Such techniques enable operators to get insights on contribution of features, prioritize risk factors, and gain confidence in prediction by models
| [6] | Jafari, H., Lee, T. and Kumar, A. (2018). Statistical modeling for casing failure prediction. Energy Systems, 9(2), pp. 123–136. |
[6]
. There are not many studies that have incorporated XML in well integrity risk assessment, especially where the labels of failures are few, which is a major gap that the research is intended to fill
| [5] | Ishkulov, I. M. (2025) ‘Interpretable machine learning to detect well integrity issues’, Journal of Mining Institute. pmi.spmi.ru |
[5]
.
Although there is an increased use of data-based methods in predicting well integrity and casing failures, the ability of current research with regard to paradigms of learning, data needs, and interpretation is vastly different. The machine learning methods that can be used in the area can be broadly classified as either supervised, unsupervised, or semi-supervised methods, all of which have their own benefits and shortcomings in the context of the complex downhole conditions and the sparse availability of failure labels. These methods need to be systematically compared to elucidate their applicability and to establish gaps in research, especially concerning the ability to handle small amounts of labeled data and also to be transparent in model forecasting. The subsections below overview the uses and issues of these types of machine learning in the management of well integrity and place the innovative input of the current study.
2.1. Supervised Machine Learning Approaches in Well Integrity Prediction
The well integrity and casing failure prediction where failure data are labeled have seen wide use of supervised machine learning methods. The data on the connection between downhole operational factors and the failure results have been modeled with the help of such techniques as logistic regression, random forest, gradient boosting, and neural networks
| [7] | Li, X., Chen, Z., and Wu, Y. (2020). Machine learning applications for casing failure prediction in oil and gas wells. Journal of Petroleum Science and Engineering, 185, 106664.
https://doi.org/10.1016/j.petrol.2019.106664 |
| [10] | Lundberg, S. M., and Lee, S.-I. (2017). A unified approach to interpreting model predictions. Advances in Neural Information Processing Systems, 30, pp. 4765–4774. |
| [14] | Nguyen, T., Tran, D., and Pham, L. (2021). Sensor-based machine learning models for casing integrity monitoring. Journal of Petroleum Exploration and Production Technology, 11, pp. 3899–3912.
https://doi.org/10.1007/s13202-021-01234-7 |
[7, 10, 14]
. These techniques are useful in nonlinear relationship representation as well as better predictive accuracy than the conventional statistical models. The performance of these models is, however, highly dependent on the availability of large and high-quality labeled data, which are not very common in well integrity applications because of the rare cases when casing failures occur. Moreover, most supervised models are black-box, which restricts their use in safety-critical settings where customers need to trust the model decisions and their transparency
| [11] | Ma, X., Hou, M. & Zhan, J. (2023) ‘Interpretable predictive modeling using SHAP and LIME in energy systems’, Energies, 16(9), 3653. mdpi.com |
| [12] | Ma, X., Hou, M., and Zhan, J. (2023). Explainable machine learning for energy system risk prediction using SHAP and LIME. Energies, 16(9), 3653.
https://doi.org/10.3390/en16093653 |
[11, 12]
.
2.2. Unsupervised Learning Methods and Their Limitations
Alternatives to supervised methods have been investigated using unsupervised learning, such as clustering and anomaly detection, in cases when the labels of failure are not available or complete. The k-means clustering, isolation forests, and autoencoders have all been utilized to extract abnormal patterns of operations that could be indicative of a potential integrity problem
| [18] | Yoon, A. S., Lee, T., Lim, Y., Jung, D., Kang, P., Kim, D., Park, K. & Choi, Y. (2017) ‘Semi?supervised Learning with Deep Generative Models for Asset Failure Prediction’, arXiv preprint. arxiv.org |
[18]
. Although these methods are handy in identifying non-normal behavior, they fail to explicitly measure risk of failure and even give probabilistic forecasts. In addition, the physical failure mechanisms interpretation of the observed anomalies is still not straightforward, which limits their direct use in operational decision-making in well integrity management.
2.3. Semi-supervised Learning for Sparse Failure Labels
In semi-supervised learning, both the labeled data and the unlabeled data are combined to enhance the learning of the model in the event the number of labeled data is small. Semi-supervised methods have been adopted in the context of well integrity to utilize the bulk of operational data that has not been labeled and the few reported failure incidents
| [19] | Zhang, J., Wu, L., Jia, D., Wang, L., Chang, J., Li, X., Cui, L. & Shi, B. (2022) ‘A Machine Learning Method for the Risk Prediction of Casing Damage and Its Application in Waterflooding’, Sustainability, 14(22), 14733. mdpi.com |
| [20] | Zhang, W., Eckert, A., Hilgedick, S. A., Goodman, H. & Meng, M. (2022) ‘Wellbore integrity: An integrated experimental and numerical study to investigate pore pressure variation during cement hardening under downhole conditions’, SPE Journal, 27(1), pp. 488-503. |
[19, 20]
. The approaches can reduce the class imbalance issue and enhance generalization performance over and above supervised models. Nonetheless, most of the current semi-supervised applications are more concerned with predictive performance and pay little attention to model interpretability that is critical in ensuring safety and adherence to regulation in the oil and gas sector.
2.4. Explainable Machine Learning
The lack of transparency with regard to complex predictive models has been filled with explainable machine learning, such as SHAP, LIME, and attention-based models
| [11] | Ma, X., Hou, M. & Zhan, J. (2023) ‘Interpretable predictive modeling using SHAP and LIME in energy systems’, Energies, 16(9), 3653. mdpi.com |
| [17] | Wang, M., Su, X., Song, H., Li, D. and Zhao, L. (2025). Enhancing predictive maintenance strategies for oil and gas equipment through ensemble learning modeling. Journal of Petroleum Exploration and Production Technology.
https://doi.org/10.1007/s13202-025-01931-x |
[11, 17, 22]
. These techniques give feature-level descriptions which assist operators to comprehend the contribution of individual parameters to the anticipated risks. Whereas explainable ML has been used in energy systems and equipment failure analysis, little has been done to combine it with semi-supervised learning when tackling the analysis of well integrity risks. Specifically, little research has conducted a methodical integration of semi-supervised learning and explainability to solve sparse failure labels with interpretability retained. It is this gap that drives the current study that combines semi-supervised learning with explainable gradient-boosted models to improve both predictive performance and decision transparency in the well casing failure risk estimation.
3. Methods
3.1. Data Collection and Description
Multi-source downhole and operating data of operational wells, such as real field data and synthetic improvements, were employed to deal with sparse failure labels in the study. The data had important parameters of casing integrity determination, such as annular pressure (PSI), cement bond quality (normalized 0-1), downhole vibration (mm/s), temperature (oC), flow rate (m3/day), torque (Nm), and acoustic signal (dB). Failure events were infrequent, less than 5% of which were documented. To enhance physical realism, synthetic failures were created according to the existing historical patterns to train the models.
3.1.1. Synthetic Data Generation and Credibility Considerations
Since the events of casing failures are infrequent and have less than 5% of the data in the available records, synthetic data was created to aid in training the model and to alleviate extreme imbalance in the classes. Physically informed, data-driven principles were used to generate synthetic data instead of augmentation by pure random, to make them realistic and plausible. Controlled interpolation and constrained perturbation of existing field data was used to produce synthetic samples based on known physical relationships among downhole parameters. Precisely, operational variables that included annular pressure, cement bond quality, vibration, temperature and flow rate were perturbed within physically plausible values based on past experiences and engineering limits. Correlations between variables were maintained by these perturbations so that failure scenarios that were synthesized were realistic working conditions and not artificial correlation structures. The approach taken (as compared to purely physics-based simulators) makes use of empirical field trends but does not violate physical limits as the detailed geomechanical and cement hydration models that are frequently unavailable or computationally prohibitive. Meanwhile, fully generative deep learning models like Generative Adversarial Networks (GANs) were also not used because of the small number of known failures, which may result in overfitting, mode collapse or the creation of non-physical samples during low-data regimes. Synthetic failure marks are designated on the combinations of high pressure in the annulus, the loss of cement bond integrity, and the amplified vibration levels in the downhole, and the indicators are in line with the known casing failure modes. This plan avoided random statistical labelling of failures, but instead gave them engineering-consistent failure modes.
3.1.2. Potential Biases and Limitations of Synthetic Data
In addition, synthetic data can enhance the power of the model under sparse-label conditions, but otherwise, they can create biases. A possible bias is a reinforcement of the past patterns of failure whereby it will diminish the sensitivity to new or new patterns of failure. Also, there is a risk that synthetic samples produced via interpolation do not represent extreme conditions which are out of the historical operating envelope. To counter these effects, the synthetic data were never used to substitute the real field observations but to complement it and they modeled the testing data held-out test real and field-derived data. Besides, explainability analysis based on SHAP values was used to confirm that model predictions were physically understandable and were not influenced by artificial effects. This is a middle ground where synthetic data are used to complement knowledge, rather than replacing it, and the existing drawbacks linked with data augmentation in safety-critical systems are taken into consideration.
3.2. Data Preprocessing
The raw data were subject to a number of pre-processing procedures in order to ensure quality and reliability. High-frequency noise was removed using Butterworth low-pass filter, and missing values were addressed using forward-filling and domain-informed imputation. Features were normalized to put all the values in the range of [0, 1] using min-max scaling:
(1)
Temporal analysis was performed by applying fixed length monthly segmentation to identify the trend in operations in order to detect the operating failure patterns.
3.3. Explainable ML Framework
The use of an XGBoost classifier was through its capability to learn non-linear associations, as well as sparse labels. To interpret the predictions, SHAP (Shapley Additive Explanations) values had to be computed to identify the contribution of the features. Among the factors that were observed to be the main risk contributors include high annular pressure, low cement bond integrity and high vibration. Every well was given a risk rating, which was the approximate likelihood of casing failure. This assisted in temporary monitoring of risks which aided in early identification of wells that were headed to failure.
3.4. Model Training and Evaluation
The dataset was divided into two set 80% training and 20% testing. Hyperparameters (learning rate, maximum depth, number of estimators) were optimized via grid search with 5-fold cross-validation. The models were evaluated using standard classification metrics:
Accuracy
(2)
Where:
1) TP = True Positives (wells correctly predicted as high-risk),
2) TN = True Negatives (wells correctly predicted as low-risk),
3) FP = False Positives (wells incorrectly predicted as high-risk),
4) FN = False Negatives (wells incorrectly predicted as low-risk).
Precision
Where:
1) TP = True Positives,
2) FP = False Positives.
Recall (Sensitivity)
Where:
1) TP = True Positives,
2) FN = False Negatives.
F1-Score
(5)
Where:
Precision and Recall are as defined above.
To evaluate temporal performance, monthly risk scores were computed for each well, enabling assessment of early warning lead times prior to observed failures. The framework was also compared to baseline models (logistic regression and random forest without SHAP) to demonstrate the advantage of explainable predictions.
Since the failure events occupy less than 5 percent of the data, accuracy alone may give a misleading impression of how the model is performing. High accuracy may be achieved just by making the correct prediction of the majority class (non-failure wells), and missing the instances of minority classes (failure wells). To this end we focused on precision, recall and F1-score which give a more balanced view of model performance in the presence of class imbalance: Precision indicates the percentage of the wells which have been predicted as wells of high risk that are actually of high risk. The recall (Sensitivity) indicates the percentage of real high-risk wells that the system identifies correctly. F1-Score gives a score that is a combination of precision and recall, and this is the criteria that shows the balance between false positives and false negative. Also, the AUC-ROC (Area Under the Receiver Operating Characteristic curve) was employed to measure the capability of the model to determine the differentiating factor between high-risk and low-risk wells at different classification levels. Greater values of AUC-ROC show greater discriminatory ability when the class is imbalanced. Lastly, confusion matrices were created on the test set to visualize true positives, true negatives, false positives, and false negatives to give a good visual of the model prediction error as well as its operational reliability. Such a multi-metric analysis can be used to ensure the predictive power of the model is well estimated, especially when there are sparse failure labels.
4. Results and Discussion
4.1. Model Prediction Performance
Table 1 shows the model prediction performance metrics of XML framework on test wells.
Table 1. Performance Metrics of XML Framework on Test Wells.
Metric | Value |
Accuracy | 91% |
Precision | 0.87 |
Recall | 0.89 |
F1-score | 0.88 |
Table 1 shows that the model achieved an F1-score of 0.88, precision of 0.87, recall of 0.89 and accuracy of 91% in classifying wells as high risk and low risk. Although it was revealed through recall that the model was effective in identifying all wells that failed (89%), it was also revealed that precision also indicated that about 87% of all wells identified as high risk were actually high risk wells. The model is also reliable when it comes to monitoring its operations based on the fact that the F1 score is balanced and indicates that there is a significant trade-off between false positives and false negatives. This evidence shows that the XML structure can successfully prioritize observations, preventive interventions, and reduce the risk of unknown wrapper failures even in low amount labelled data of failure events.
4.2. Key Feature Contributions to Failure Risk
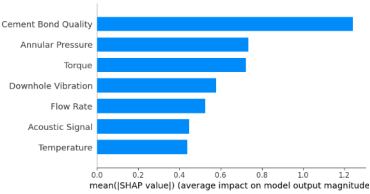
Figure 1 shows the SHAP Summary Plot Highlighting Feature Importance for Casing Failure Risk.
Figure 1. SHAP Feature Importance.
SHAP analysis provides quantitative insight into which operational characteristics most influence model predictions.
Figure 1 shows that high annular pressure (5,500–6,200 psi), low cement bond quality (normalized scale values 0.35–0.60), and elevated downhole vibration (0.8–1.5 mm/s) contribute most significantly to the estimated risk. Specifically, high vibration added roughly +0.28 to the overall risk score for individual wells, poor cement bond increased by +0.32, and abnormal pressure fluctuations alone raised the risk score by +0.45. Additional factors include flow rate variations at +0.10 and temperature anomalies at +0.12. Using this kind of detailed, feature-level interpretation, operators can prioritize specific inspections, pinpoint the most important circumstances for possible casing failure, and carry out preventative maintenance based on data-driven risk assessments.
4.3. Temporal Risk Scoring for Individual Wells
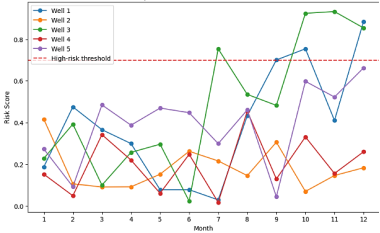
Figure 2 shows the Temporal Risk Scores for Selected Wells.
Figure 2. Temporal Risk Scores for Selected Wells.
By evaluating wells over time, the XML model produced well-specific risk trajectories with monthly resolution. The wells with risk scores exceeding 0.7 are similar to the recorded failure events. As an example, Well 1 risk score improved between 0.45 in month 6 to 0.78 in month 9, Well 3 between 0.50 and 0.82 in months 5 and 8 respectively and Well 5 between 0.42 and 0.87 in months 7 and 10 respectively. Such trends had a low-cost of early warning of 2-6 months of actual failures. These tracts may be observed in
Figure 2, and it proves that the model can not only define high-risk wells but also measure the time course of risk. Such a time-related feature enables operators to arrange specific inspections and proactive maintenance, to optimize the distribution of resources and the risk of catastrophic failures of casing is to be minimized.
4.4. Comparison with Baseline Models
Table 2 shows the performance comparison with baseline model.
Table 2. Performance Comparison with Conventional Models.
Model | F1-Score |
Logistic Regression | 0.78 |
Random Forest (no explainability) | 0.81 |
Proposed XML Framework | 0.88 |
XML framework has been found to be more interpretable and predictive as compared to the traditional models. Specifically, the F1-score of 0.78 of logistic regression to 0.81 of random forest and 0.88 of XML framework. This is a 12.8 percent better result than Logistic Regression and an 8.6 percent better result than Random Forest. XML framework is made of SHAP explanation, which measures the contribution of each of the functions, allowing operators to be informed of the most important threat drivers, including but not limited to annular pressure (+0.45), cement bond integrity (0.32), and vibration (0.28), unlike the predictive of the baseline model, which yields simplest predictions with no insight. This cumulative high predictive accuracy and operative interpretation leads to the right integrity control, specific inspections and preventive measures.
5. Conclusion
This paper shows that explainable machine learning (XML) is able to be useful in predicting well casing failure risk even when labelled data are sparse. The technique offers superior forecasting precision by combining the gradient boosted trees and SHAP/feature attribution. Also, it provides understandable knowledge on the working parts which result in failure. Since it was statistically demonstrated that such significant predictors as anomalies in annular pressure, low-quality cement bonds, and over-vibration of the downhole were statistically associated with increased risk of failure, operators could prioritize wells lacking sufficient condition to be monitored and preventatively to be dealt with. The framework provides a flexible and scalable operational maintenance and risk assessment tool by enabling the reduction of the gap between operational decision-making and data-driven risk assessment. Temporal risk scoring demonstrated the capability of the model in offering an early warning interval of 2-6 months that would be used to manage the active wells. Future studies can be oriented towards improvement of the multi-well framework, the use of real-time streaming information, and integration of well integrity models based on physics, which can improve predictive performance and reliability of the operation. The suggested XML strategy is a powerful, readable and implementable solution to enhance the safety of the well, to minimize the non-productive time and to facilitate the efficient work of the oil field.
Abbreviations
XGBoost | Extreme Gradient Boosting |
ML | Machine Learning |
XML | Explainable Machine Learning |
SHAP | Shapley Additive Explanations |
LIME | Local Interpretable Model-Agnostic Explanations |
Author Contributions
John Lander Ichenwo: Conceptualization, Resources, Supervision, Validation, Visualization, Project Administration, Writing – original draft, Writing – review & editing
Ogwu Philip: Data curation, Methodology, Software, Writing – original draft, Writing – review & editing
Conflicts of Interest
The authors declare no conflicts of interest.
References
| [1] |
Alvarez, J., Smith, R. and Johnson, P. (2020). Well integrity management in complex subsurface environments. Journal of Petroleum Engineering, 45(3), pp. 210–223.
|
| [2] |
Azmi, P. A. R., Yusoff, M., and Sallehuddin, M. T. M. (2024). A review of predictive analytics and machine learning applications in oil and gas engineering systems. Sensors, 24(12), 4013.
https://doi.org/10.3390/s24124013
|
| [3] |
Doshi-Velez, F., and Kim, B. (2017). Towards a rigorous science of interpretable machine learning. arXiv preprint, arXiv: 1702.08608.
|
| [4] |
Ben Seghier, M. E. A., Mohamed, O. A., & Ouaer, H. (2024). Machine learning-based Shapley additive explanations approach for corroded pipeline failure mode identification. Structures, 65, 106653.
https://doi.org/10.1016/j.istruc.2024.106653
|
| [5] |
Ishkulov, I. M. (2025) ‘Interpretable machine learning to detect well integrity issues’, Journal of Mining Institute. pmi.spmi.ru
|
| [6] |
Jafari, H., Lee, T. and Kumar, A. (2018). Statistical modeling for casing failure prediction. Energy Systems, 9(2), pp. 123–136.
|
| [7] |
Li, X., Chen, Z., and Wu, Y. (2020). Machine learning applications for casing failure prediction in oil and gas wells. Journal of Petroleum Science and Engineering, 185, 106664.
https://doi.org/10.1016/j.petrol.2019.106664
|
| [8] |
Li, Y., Guo, H. & Paplinski, A. (2018) ‘Semi-Supervised Classification for Oil Reservoir’, arXiv preprint. arxiv.org
|
| [9] |
Li, Y., Guo, H., and Paplinski, A. (2018). Semi-supervised learning approaches for fault detection under limited labeled data. IEEE Transactions on Industrial Informatics, 14(6), pp. 2566–2576.
https://doi.org/10.1109/TII.2017.2778076
|
| [10] |
Lundberg, S. M., and Lee, S.-I. (2017). A unified approach to interpreting model predictions. Advances in Neural Information Processing Systems, 30, pp. 4765–4774.
|
| [11] |
Ma, X., Hou, M. & Zhan, J. (2023) ‘Interpretable predictive modeling using SHAP and LIME in energy systems’, Energies, 16(9), 3653. mdpi.com
|
| [12] |
Ma, X., Hou, M., and Zhan, J. (2023). Explainable machine learning for energy system risk prediction using SHAP and LIME. Energies, 16(9), 3653.
https://doi.org/10.3390/en16093653
|
| [13] |
Nguyen, T., Tran, D. and Pham, L. (2021). Sensor-data-driven casing failure identification using neural networks. Journal of Energy Analytics, 3(4), pp. 89–103.
|
| [14] |
Nguyen, T., Tran, D., and Pham, L. (2021). Sensor-based machine learning models for casing integrity monitoring. Journal of Petroleum Exploration and Production Technology, 11, pp. 3899–3912.
https://doi.org/10.1007/s13202-021-01234-7
|
| [15] |
Processes (2023). Explainable Machine Learning-Based Method for Fracturing Prediction of Horizontal Shale Oil Wells. Processes, 11(9), 2520.
https://doi.org/10.3390/pr11092520
|
| [16] |
Santos, G., Pinto, T., Ramos, C., and Corchado, J. M. (2023). Explainable artificial intelligence for decision support in energy systems. Frontiers in Energy Research, 11, 1269397.
https://doi.org/10.3389/fenrg.2023.1269397
|
| [17] |
Wang, M., Su, X., Song, H., Li, D. and Zhao, L. (2025). Enhancing predictive maintenance strategies for oil and gas equipment through ensemble learning modeling. Journal of Petroleum Exploration and Production Technology.
https://doi.org/10.1007/s13202-025-01931-x
|
| [18] |
Yoon, A. S., Lee, T., Lim, Y., Jung, D., Kang, P., Kim, D., Park, K. & Choi, Y. (2017) ‘Semi?supervised Learning with Deep Generative Models for Asset Failure Prediction’, arXiv preprint. arxiv.org
|
| [19] |
Zhang, J., Wu, L., Jia, D., Wang, L., Chang, J., Li, X., Cui, L. & Shi, B. (2022) ‘A Machine Learning Method for the Risk Prediction of Casing Damage and Its Application in Waterflooding’, Sustainability, 14(22), 14733. mdpi.com
|
| [20] |
Zhang, W., Eckert, A., Hilgedick, S. A., Goodman, H. & Meng, M. (2022) ‘Wellbore integrity: An integrated experimental and numerical study to investigate pore pressure variation during cement hardening under downhole conditions’, SPE Journal, 27(1), pp. 488-503.
|
| [21] |
Zhou, Y., Liu, H., Wang, K., and Zhang, X. (2024). Explainable machine learning for failure risk assessment in complex engineering systems. Engineering Applications of Artificial Intelligence, 126, 107021.
https://doi.org/10.1016/j.engappai.2023.107021
|
Cite This Article
-
APA Style
Ichenwo, J. L., Philip, O. (2026). Explainable Machine Learning for Well Integrity and Casing Failure Risk with Sparse Failure Labels. American Journal of Energy Engineering, 14(1), 27-33. https://doi.org/10.11648/j.ajee.20261401.14
 Copy
|
Copy
|
 Download
ACS Style
Ichenwo, J. L.; Philip, O. Explainable Machine Learning for Well Integrity and Casing Failure Risk with Sparse Failure Labels. Am. J. Energy Eng. 2026, 14(1), 27-33. doi: 10.11648/j.ajee.20261401.14
Copy
|
Download
AMA Style
Ichenwo JL, Philip O. Explainable Machine Learning for Well Integrity and Casing Failure Risk with Sparse Failure Labels. Am J Energy Eng. 2026;14(1):27-33. doi: 10.11648/j.ajee.20261401.14
Copy
|
Download
-
@article{10.11648/j.ajee.20261401.14,
  author = {John Lander Ichenwo and Ogwu Philip},
  title = {Explainable Machine Learning for Well Integrity and Casing Failure Risk with Sparse Failure Labels},
  journal = {American Journal of Energy Engineering},
  volume = {14},
  number = {1},
  pages = {27-33},
  doi = {10.11648/j.ajee.20261401.14},
  url = {https://doi.org/10.11648/j.ajee.20261401.14},
  eprint = {https://article.sciencepublishinggroup.com/pdf/10.11648.j.ajee.20261401.14},
  abstract = {The integrity of the well is critical to efficient and safe oil and gas operations because few records exist of casing failure, and conditions in the downhole are complicated. In this study, an explainable machine learning (XML) framework is introduced to estimate the risk of casing failures in limited labelled wells. Which is based on measurements of pressure, temperature, annular pressure, cement bond quality and downhole vibration but integrates semi-supervised learning with gradient-boosted trees to predict the likelihood of failure. SHAP (Shapley Additive Explanations) values gives explanations on the feature level, and these values can be used to determine how operational parameters can contribute to risk predictions. Experimentation with synthetic and field-derived datasets shows that the XML framework has an accuracy of 91%, a precision of 0.87, a recall of 0.89, and a F1-score of 0.88. The critical predictors such as pressure differences in the annulus, low bond integrity of cement, and high vibration were quantitatively related with high risk of failures, whereas the risk scoring at the time gave a premonition to the known failures 2-6 months before the recorded failures. The improvement in the prediction performance and interpretability of the framework is evident when it is compared to the baseline models such as logistic regression and standard random forest. In low failure label environments, the technique fills the gap between risk assessment based on data and operational decision making by integrating the strong prediction with actionable information that enables operators to focus more on tracking, preventive actions, and to save on time on non-productive activities.},
 year = {2026}
}
Copy
|
Download
-
TY  - JOUR
T1  - Explainable Machine Learning for Well Integrity and Casing Failure Risk with Sparse Failure Labels
AU  - John Lander Ichenwo
AU  - Ogwu Philip
Y1  - 2026/02/24
PY  - 2026
N1  - https://doi.org/10.11648/j.ajee.20261401.14
DO  - 10.11648/j.ajee.20261401.14
T2  - American Journal of Energy Engineering
JF  - American Journal of Energy Engineering
JO  - American Journal of Energy Engineering
SP  - 27
EP  - 33
PB  - Science Publishing Group
SN  - 2329-163X
UR  - https://doi.org/10.11648/j.ajee.20261401.14
AB  - The integrity of the well is critical to efficient and safe oil and gas operations because few records exist of casing failure, and conditions in the downhole are complicated. In this study, an explainable machine learning (XML) framework is introduced to estimate the risk of casing failures in limited labelled wells. Which is based on measurements of pressure, temperature, annular pressure, cement bond quality and downhole vibration but integrates semi-supervised learning with gradient-boosted trees to predict the likelihood of failure. SHAP (Shapley Additive Explanations) values gives explanations on the feature level, and these values can be used to determine how operational parameters can contribute to risk predictions. Experimentation with synthetic and field-derived datasets shows that the XML framework has an accuracy of 91%, a precision of 0.87, a recall of 0.89, and a F1-score of 0.88. The critical predictors such as pressure differences in the annulus, low bond integrity of cement, and high vibration were quantitatively related with high risk of failures, whereas the risk scoring at the time gave a premonition to the known failures 2-6 months before the recorded failures. The improvement in the prediction performance and interpretability of the framework is evident when it is compared to the baseline models such as logistic regression and standard random forest. In low failure label environments, the technique fills the gap between risk assessment based on data and operational decision making by integrating the strong prediction with actionable information that enables operators to focus more on tracking, preventive actions, and to save on time on non-productive activities.
VL  - 14
IS  - 1
ER  -
Copy
|
Download