-- Select One -- | | Peer-Reviewed

Research on Ore Loss and Dilution Control Based on Three-dimensional Visualization

Received: 12 April 2025     Accepted: 17 June 2025     Published: 26 June 2025
Views:       Downloads:
Abstract

The loss and dilution of ore are two important indicators in the evaluation of goaf operation. In order to more timely and accurately reflect the loss and dilution rate after the end of each stope mining, this paper uses BLSS-HL three-dimensional laser scanning system to scan two goafs (724 # -2,714 #) in a deep mining area of a gold mine, and establishes a three-dimensional visualization model. Based on the point cloud data of the two goafs obtained by scanning, the point cloud data of the two goafs are processed by Cloud Compare point cloud processing software. Based on the point cloud data, the 3DMine mining software was used to establish the solid model of the two goafs, and the loss and dilution index was calculated, so as to realize the visualization of the loss and dilution of the stope. The goaf volume of 724 # -2 stope is 15890.87m3, the dilution rate is 3.12%, and the loss rate is 16.59%. The goaf volume of 714 stope is 10266.22m3, the dilution rate is 27.21%, and the loss rate is 14.15%. Based on the empty area model, the depletion loss of the two stopes was analyzed. The blast hole profile of 724 # -2 stope is established, which provides a reference for the design of medium-deep hole low-depletion blasting in two-step stope.

Published in American Journal of Energy Engineering (Volume 13, Issue 2)
DOI 10.11648/j.ajee.20251302.13
Page(s) 67-76
Creative Commons

This is an Open Access article, distributed under the terms of the Creative Commons Attribution 4.0 International License (http://creativecommons.org/licenses/by/4.0/), which permits unrestricted use, distribution and reproduction in any medium or format, provided the original work is properly cited.

Copyright

Copyright © The Author(s), 2025. Published by Science Publishing Group

Keywords

Three-dimensional Visualization, Goaf, Ore Dilution, Ore Loss, Two-step Stoping

1. Introduction
With the continuous development of society and the continuous growth of per capita GDP, China's demand for mineral resources is also increasing greatly, so the output of mineral resources across the country is also rising. However, China's mineral resources reserves are limited. With the continuous mining of existing mines, China's ore will be exhausted one by one through mining operations in the future . In the face of such difficulties, on the one hand, geologists have been committed to finding new exploitable mineral resources; on the other hand, it requires mining workers to make effective use of existing mineral resources and minimize the waste of existing mineral resources. Among them, the loss and dilution of ore are two important indicators in the process of goaf operation. Ore loss will cause waste of resources, while ore dilution will increase the mining cost of the mine and reduce its economic benefits . How to recover more valuable ores during the recovery process to avoid the mixing of waste stones; at the same time, how to truly and accurately understand the loss and dilution of each stope after the recovery process, so as to effectively avoid the subsequent recovery process, has been the subject of many mining scholars. For example, Zhang Xiuhua et al designed three different test schemes for the sublevel caving method in Chang'an Gold Mine, and systematically compared the effects of different schemes through indoor ore drawing tests, providing an effective solution to the problem of ore loss and dilution. Lin Zhaohui et al take the first mining area of No. 1 copper belt of Dahongshan Iron Mine as the research object, study the loss and dilution problems in the process of mining and put forward corresponding control measures. Cheng Guanghua et al used the total station measurement technology to measure the boundary points of the goaf, combined with the three-dimensional mining software (Surpac) for data processing, which can effectively calculate the mining loss rate and dilution rate. Liu Yafei analyzed the causes of ore loss and dilution in the mining process of open-pit molybdenum mine, used mining software ( such as Surpac, Dimine, etc. ) to construct a three-dimensional space model, improved the accuracy of ore body boundary and geological condition analysis, and proposed a layered mining and stripping method to reduce ore loss and dilution. In addition, Liu Guoyin et al determined that the height of 12 m was a reasonable choice through the study of the height of the sublevel caving method. This height shows high drilling efficiency and good blasting effect in actual production, which significantly reduces the ore loss and dilution rate.
However, there is a certain lag in the above analysis and research results, which cannot provide a timely feedback for the mining work. But for underground mining, in order to solve this problem, it is necessary to measure the goaf at the end of the mining in time. At present, the main detection methods for underground goaf are traditional drilling methods, comprehensive geophysical exploration methods, three-dimensional seismic methods, transient electromagnetic methods, high-density resistance methods, and geological radar detection methods, etc. Although these mainstream detection methods can meet the requirements of on-site goaf detection, there are defects such as high labor intensity and slow timeliness. At present, the use of three-dimensional laser scanning technology to measure underground goaf can make up for the defects of traditional geophysical methods to a certain extent.
In this paper, three-dimensional laser scanning technology is used to detect the goaf, and the corresponding three-dimensional goaf model is established. Combined with the existing stope recovery design drawings of the mine, the loss and dilution rate of a single stope is analyzed and calculated. And the established model is used to provide guiding opinions for the mine's two-step recovery.
2. 3D Laser Scanning Technology of Goaf
2.1. 3D Laser Scanning Scheme of Goaf
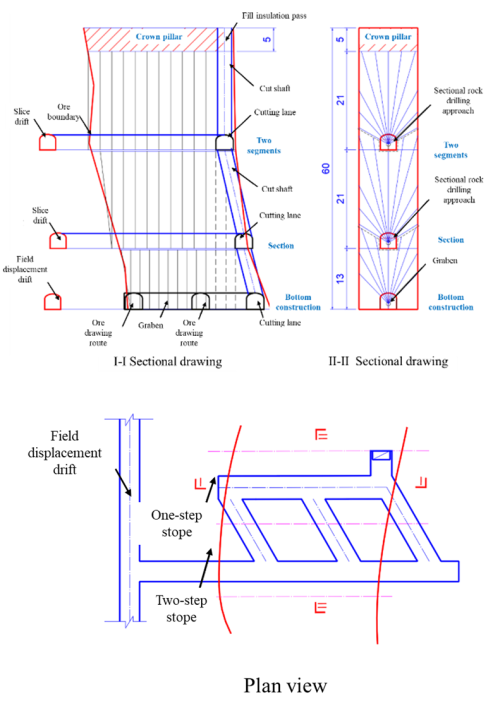
Figure 1. High sublevel open stoping with subsequent filling mining method diagram.
The sections of the mine that have been developed are 2292m, 2230m, 2110m, 2050m, 1990m and 1950m. The ore body in the middle section of 2230m and below adopts the segmented empty field subsequent filling mining method, and the deep mining area (2050m, 1990m middle section) is converted to the high segmented empty field subsequent filling mining method for recovery. The stope structure parameters of the high segmented empty field subsequent filling mining method are the height of the middle section 60m, the thickness of the top pillar is 5m, the height of the bottom structure is 13m, the height of the second section is 21m, and the height of the third section is 21m. The width of the stope is 12.5m (the deep mining area is adjusted to 11m). The length of the stope is the thickness of the ore body of 25~30m (arranged vertically) (as shown in Figure 1). The underground stope is divided into two steps of mining, one step is to open a mining house. After the ore is produced, it is filled with high-strength cementation. After the filling body reaches a certain strength, the two steps are to open a mining column. After the ore is produced, it is filled with full tailings and micro-cementation.
The two stopes studied in this paper (724 # -2 stope, 714 # stope) are located in the middle of 1990 and belong to the deep stope. Among them, 724 # -2 stope is a one-step stope and 714 # stope is a two-step stope. The scanning personnel are located in the 2024-level segmented drilling route, and the scanning equipment is sent into the goaf for scanning by using the extension rod (as shown in Figure 2).
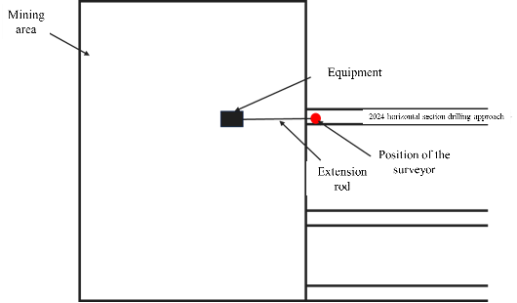
Figure 2. Field scanning schematic diagram.
2.2. Goaf Model Construction
Based on the above goaf scanning scheme, the 724#-2 stope and the 714# stope are scanned in 3D at the 2024 level. Among them, the number of point clouds obtained by scanning in the 724#-2 stope is 35666737, and the number of point clouds obtained by scanning in the 714# stope is 34257621. For the accuracy and efficiency of later modeling, the point cloud processing software is used to reduce noise, streamline and register point clouds in the 724#-2 stope and the 714# stope respectively . Finally, the processed point cloud data is imported into the 3Dmine mining software to establish a three-dimensional model of the goaf (as shown in Figure 3). Through the three-dimensional model of the goaf, the total volume of the 724#-2 goaf can be calculated to be 15890.87m3, while the total volume of the 714# goaf is 10266.22m3.
3. Analysis of Dilution Loss in Stope
3.1. Calculation of Loss Rate of Stope Dilution
The ore loss rate and ore dilution rate of each section stope are further calculated by using the ore overmining and loss volume calculated by 3DMine. The known density of the upper and lower rock masses is 2.72t/m3, 2.74t/m3, the ore density is 2.77t/m3, and the loose ore density is 1.84t/m3, respectively. Based on this, the overmining amount and lost ore amount of each section stope can be calculated, and then the ore loss rate and dilution rate can be calculated by using equations (1) and (2).
S=QSQ(1)
In the equation:
S - ore loss rate,%; QS - lost ore volume, t;
Q - designed recovered ore volume, t.
P=1-Q-QSC+CYCYQCC2(2)
In the formula:
P - ore dilution rate,%; Q - design amount of recovered rock, t; C - design ore grade, g/t;
QS - lost ore volume, t; QY - the amount of waste rock mixed in, t; CY - mixed waste grade, g/t; QC - the amount of mined stone, t.
3.2. Analysis of Dilution Loss of 724 #-2 Stope
3.2.1. Dilution Analysis of 724 #-2 Stope
Table 1. 724#-2 stope dilution index table.

Bottom structure

Section

Two segments

Subtotal

Over mining

V/m3

Hanging wall

20.11

172.36

49.66

242.13

Footwall

9.16

129.73

113.88

252.77

m/t

Hanging wall

54.70

468.82

135.07

658.59

Footwall

25.09

355.46

312.04

692.59

Goaf volume/m3

4080.91

7885.66

3924.31

15890.87

Ore grade

2.55

3.42

3.71

3.30

Ore dilution rate

0.76%

3.78%

4.12%

3.12%

Table 2. 724#-2 stope loss index table.

Bottom structure

Section

Two segments

Subtotal

Design back mining volume/t

11458.82

20069.63

14820.00

46348.45

Under-mining stone

V/m3

224.61

235.76

1881.63

2342.00

m/t

622.18

653.04

5212.13

6487.35

Undiscovered ore

V/m3

652.45

/

652.45

m/t

1200.51

1200.51

Ore mining loss rate

15.91%

3.25%

35.17%

16.59%

Table 3. 714# stope dilution index table.

Bottom structure

Section

Two segments

Subtotal

Over mining

V/m3

Hanging wall

315.24

472.59

10.28

798.11

Footwall

/

6.37

145.27

151.63

East side

263.32

639.59

185.06

1087.97

West side

49.53

787.49

374.94

1211.96

m/t

Hanging wall

263.32

639.59

185.06

1087.97

Footwall

49.53

787.49

374.94

1211.96

East side

526.64

1279.18

370.12

2175.94

West side

99.06

1574.97

749.89

2423.92

Goaf volume/m3

1683.80

5477.38

3105.04

10266.22

Ore grade

2.35

8.62

1.03

4.78

Ore dilution rate

27.87%

25.38%

13.60%

27.21%

Table 4. 714# stope loss index table.

Bottom structure

Section

Two segments

Subtotal

Design back mining volume/t

5379.82

12615.95

9469.86

27465.62

Under-mining stone

V/m3

65.03

281.03

520.63

866.70

m/t

180.14

778.46

1442.15

2400.76

Undiscovered ore

V/m3

806.76

/

806.76

m/t

1484.44

1484.44

Ore mining loss rate

27.59%

6.17%

15.23%

14.15%

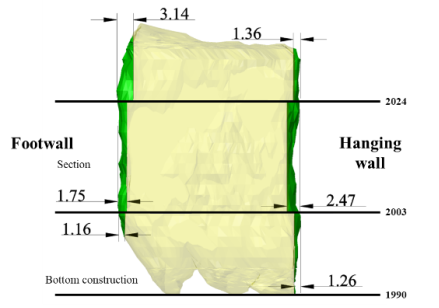
Figure 4. 724 # -2 stope hanging wall and footwall over-mining situation diagram.
Since the 724#-2 stope is a one-step stope, both sides of the stope are ore bodies. When analyzing the depletion of the stope, only the overproduction of the upper and lower plates of the stope needs to be considered. The calculation results of the overproduction of the upper and lower plates of the stope and the depletion index are shown in Figure 4 (yellow is the recovery within the design range, green is the overproduction) and Table 1.
It can be seen from Figure 4 and Table 1 that the dilution rate of the 724 #-2 stope is 3.12%, and the dilution rate of each section is 0.76%, 3.78%, and 4.12% respectively. The dilution rate of the bottom structure is the lowest, while the dilution rate of the second section is the highest. The reason for the highest dilution rate in the second section is that the overmining situation of the lower section is seriously higher than that of the other sections, and the maximum overmining range has reached 3.14m. In addition, in the sub-section, the overmining situation of the upper section is also more serious, and the maximum overmining range has reached 2.47m. This is also the main reason for the undermining dilution rate of the sub-section to reach 3.78%. Compared with the first and second sections, there is no overmining of the bottom structure. The maximum overmining range of the upper plate is 1.26m, while the maximum overmining range of the lower plate is 1.16m. The overmining volume of the upper and lower plates is small. Therefore, the dilution rate of this section is the lowest.
3.2.2. 724#-2 Stope Loss Analysis
As can be seen from Table 2 and Figure 5, the loss rate of the 724 #-2 stope is 16.59%, and the loss rates of each section are 15.91%, 3.25%, and 35.17%, respectively. Among them, there are two sources of ore loss in the bottom structure, one is the undermining stone, due to the blasting design or the lack of control during the blasting process , The east and west sides of the segment (mainly the east side) and the upper plate are unmined, resulting in ore loss; the other is unmined ore (the part circled in red in Figure 5), due to the collapse of the ore forming a heap below the natural resting angle near the cutting groove of the lower plate of the ore body , Therefore, in the case of no external force, this part of the ore has been in a stable state and will not slip. Therefore, it cannot be transported without the use of a remote control scraper, resulting in the loss of this part of the ore. In addition, in the second section, the undermining of the roof is more serious, so the ore loss rate of this section is as high as 35.17%, making it the most serious ore loss in the three sections. On the contrary, in the first section, there are undermining stones mainly on the east and west sides of the stope, and the amount of undermining stones is less, so the ore loss rate of this section is lower than that of the other two sections, only 3.25%.
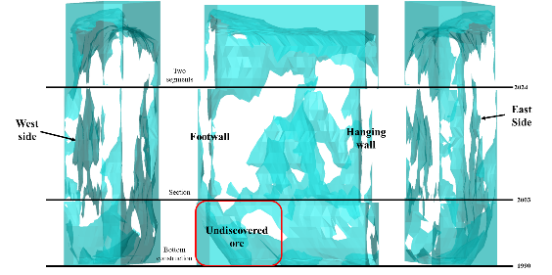
Figure 5. 724#-2 stope owe situation diagram.
3.3. Analysis of Dilution Loss of 714# Stope
3.3.1. Dilution Analysis of 714# Stope
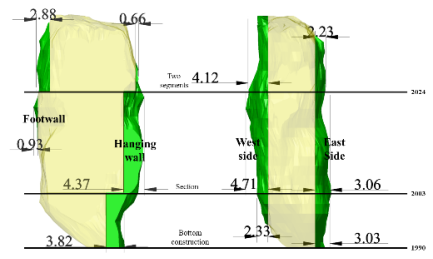
Figure 6. 714# stope overdraft situation.
Since the 714 #stope belongs to a two-step stope, both sides of the stope are filled bodies, and the density of the filled body is 2.00t/m3. Therefore, when analyzing the depletion of the stope, it is necessary to consider not only the overproduction of the upper and lower plates of the stope, but also the overproduction of the two sides of the stope. The calculation results of the overproduction situation and depletion index of the stope are shown in Figure 6 (yellow is the recovery within the design range, green is the overproduction) and Table 3.
It can be seen from Table 3 and Figure 6 that the dilution rate of the 714 #stope is 27.21%, and the dilution rates of different sections are 27.87%, 25.38%, and 13.60% respectively. The main reason for the overall high dilution rate of this stope is that the 714 #stope belongs to a two-step stope, and both sides of the stope are filled bodies. Therefore, when the overmining situation of the two sides of the stope is serious, the filling body will be mixed into the mined ore, resulting in a decrease in the grade of the mined ore. In addition, the overmining of the upper or lower stope in each section is also more serious, and the maximum overmining range is greater than 2m. For example, the maximum overexploitation range of the bottom structure in the upper plate of the stope is 3.82m, and the maximum overexploitation range on the east and west sides of the stope is 3.03m and 2.33m, respectively. The overexploitation situation of the bottom section is basically similar to that of the bottom structure. The maximum overexploitation range of the upper plate is 4.37m, and the maximum overexploitation range on the east and west sides is 3.06m and 4.71m. So the dilution rate of this section is only 8.93% lower than that of the bottom structure. In contrast to the two, the overexploitation situation of the second section is slightly better than that of the other two sections, so the dilution rate of this section is the lowest. Its dilution rate mainly comes from the lower plate and the east and west sides of the stope. The maximum overexploitation range of the lower plate is 2.88m, and the maximum overexploitation range of the east and west sides is 2.23m and 4.12 However, the maximum over-mining area on the west side of the stope is relatively small.
3.3.2. 714#stope Loss Analysis
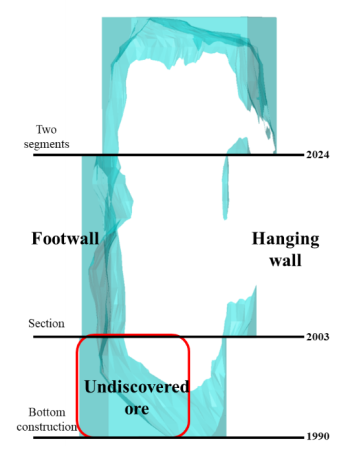
Figure 7. 714# stope undermining situation.
It can be seen from Table 4 and Figure 7 that the loss rate of the 714 #stope is 14.15%, and the loss rates of different sections are 27.59%, 6.17%, and 15.23% respectively. The ore loss rate of the bottom structure is the highest. The source of the ore loss is mainly the existence of a large amount of unmined ore in the cutting groove of the lower stope, followed by the existence of a small amount of unmined stone in the upper stope. The ore loss rate of the first section is the lowest. The main reason for the ore loss of the second section is the same as the main reason for the ore loss of the 724 #-2 stope, both of which are the existence of a large amount of unmined stone in the roof of the stope.
4. Two-step Control of Depletion Loss in Deep Hole Mining
Based on the first segmented hole design drawing in the design drawing, a cross-sectional view of each row of holes is established, as shown in Figure 9. When there is overmining or undermining in the control range of a row of holes, the cross-sectional view of the hole can provide some reference and suggestions for the two-step design recovery. In the 724 #-2 stope, there are mainly 6 rows of holes in the cross-sectional view, and there are overmining or undermining in the east and west.
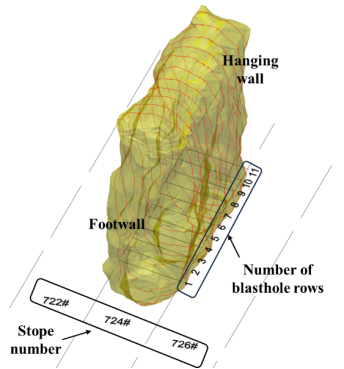
Figure 8. The schematic diagram of blasthole section in 724#-2 stope.
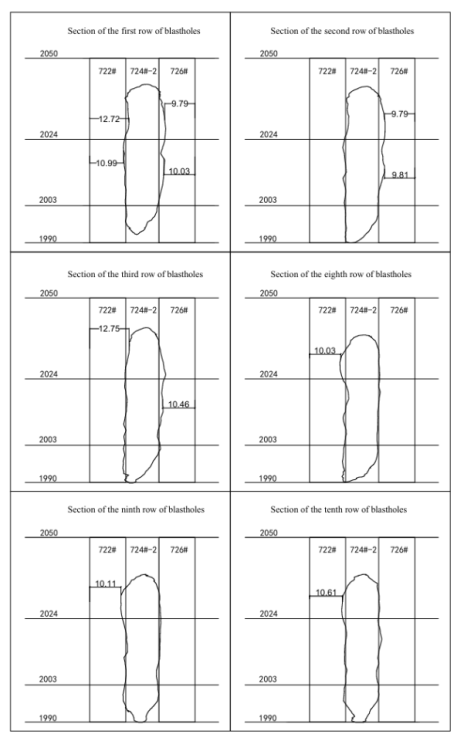
Figure 9. Single-row blasthole profile.
As shown in Figure 9, in the first row of holes, there is undermining in the first and second sections on the west side of the stope. Therefore, in the recovery design of the 722 #stope, the stope widths of the first and second sections should be expanded to 10.99m and 12.752m respectively; while there is overproduction in the first and second sections on the east side of the stope, the widths of the first and second sections of the 726 #stope should be reduced to 10.03m and 9.79m. In the second row of holes, only the first and second sections on the west side of the stope have overproduction, so the widths of the first and second sections of the 726 #stope should be reduced to 9.81m and 9.79m. In the third row of holes, there is overmining in the east section of the stope, and undermining in the second section on the west side. Therefore, when designing the third row of holes for two-step mining, the second section of the 722 #stope should be expanded to 12.75m, and the section of the 726 #stope should be reduced to 10.46m. As shown in Figure 9, in the eighth, ninth, and tenth rows of holes, the 724 #-2 stope is only overmined in the second section on the west side, so the width of the second section of the 722 #stope should be reduced to 10.03m, 10.11m, and 10.61m respectively.
4 Conclusion
1) Two goaf areas (724 #-2, 714 #) in a deep mining area of a gold mine were scanned by BLSS-HL 3D laser scanning system. Two goaf models were established through 3Dmine mining software. The volume of the goaf of 724 #-2 is 15890.87m3, and the volume of the goaf of 714 #is 10266.22m3.
2) Based on the two goaf models, the dilution loss of the two stope is analyzed. The dilution rate of the 724 #-2 goaf is 3.12%. The main reason for the dilution is that the overmining of the upper part of the first section and the lower part of the second section is too serious; the loss rate is 16.59%. The main source of ore loss is a large amount of unproduced ore in the bottom structure and a large amount of unmined stone in the second section of the roof. The dilution rate of 714 #goaf is 27.21%. The main reason for the dilution is that the bottom structure and the upper plate of the first section and the east and west sides are more serious, and the second section lower plate and the east and west sides of the stope are more serious. The loss rate is 14.15%. The main source of ore loss is that there is a large amount of unmined ore in the lower plate of the bottom structure and a large amount of unmined stone in the second section roof.
3) Establish a section view of the blast holes in the 724 #-2 goaf area, and the blasting control effect of the six rows of blast holes is poor. Among them, the first, second and third rows of blast holes are overmined and undermined in the two gangs of the three sections; while the eighth, ninth and tenth rows of blast holes are mainly overmined in the west side of the second section.
Author Contributions
Zhang Haoqiang: Funding acquisition, Resources, Project administration, Writing - review & editing
Liu Dake: Data curation, Writing - original draft
Chen Junwei: Investigation, Writing - original draft
Chen Lu: Investigation, Writing - original draft
Funding
This work is supported by China Nonferrous Metals Group Science and Technology Special Youth Project (Grant No. 2023KJZX003) and National key research and development program (Grant No. 2022YFC2904103).
Conflicts of Interest
The authors declare no conflicts of interest.
References
[1] Zhang Z-X. Lost-ore mining—a supplementary mining method to sublevel caving [J]. International Journal of Rock Mechanics and Mining Sciences, 2023.
[2] GAO Jishuan, WANG Shunxim, GAO Fenghui, et al. Practical application of filling mining method in Luoning Jijiawa gold mine[J]. Nonferrous Metals(Mining Section), 2024, 76(1): 33-39.
[3] ZHANG Xiuhua, ZHOU Zonghong, DING Wenjun, et al. Depletion control method for loss in the middle section of first mining bybottomless column segmental crumbling method at Chang'an gold mine [J]. Nonferrous Metals(Mining Section), 2023, 75(1): 20-25.
[4] LIN Zhaohui, QlN Longjiang. Discussion on the mining loss and control measures in the first miningarea of No. 1 copper mine in the Dahongshan Fe-Cu deposit [J]. China Mining Magazine, 2019, 28(S1): 245-247.
[5] CHENG Guanghua, ZHANG Liun, SHENG Xuedong, et al. Application of Surpac and total station on the analysis of mining loss anddilution rate [J]. Nonferrous Metals (Mining Section), 2014, 66(5): 91-94.
[6] LlU Yafei. Analysis of Technical Measures to Reduce Ore Loss and Depletion duringOpen-Molybdenum Mining [J]. World Nonferrous Metals, 2019(21): 34+36.
[7] LlU Guoyin, DU Degang, ZHANG Jinrong, et al. Sectional height determination of non-pillar sublevel caving method in aniron mine [J]. Nonferrous Metals(Mining Section), 2019, 71(1): 27-30.
[8] ZHANG Feng, DlAO Xinpeng, TAN Xiuguan, et al. Exploration and stability evaluation of coal mine goaf based on SBAS technology [J]. Coal Science and Technology. 2022, 50(3): 208-214.
[9] GU Pengyu, YAO Yuzeng, JlA Sanshi, et al. Research on Plane Boundary Detection of Goaf Based on High Precision Magnetic Survey Method [J]. Metal Mine, 2024(2): 247-254.
[10] Ll Yingbin, ZHANG Wei, Ll Jiangkun. Application of comprehensive geophysical prospecting method in the exploration of goaf in Yili Basin [J]. Geological Review, 2024, 70(S1): 131-132.
[11] YAO Zhiwei, FANG Zhifu, GUl Wanghua, et al. Application of 3D laser scanning technology in goaf detection of Dongguashan copper mine [J]. Nonferrous Metals (Mining Section), 2020, 72(5): 67-69.
[12] MA Yvtao, PENG Wei. Study on Cavity-Autoscanning Laser System (C-ALS) and its application in Anging Copper Mine [J]. Nonferrous Metals (Mining Section), 2013, 65(3): 1-3, 12.
[13] Chen S, Walske M L, Davies I J. Rapid mapping and analysing rock mass discontinuities with 3d terrestrial laser scanning in the underground excavation [J]. International Journal of Rock Mechanics and Mining Sciences, 2018, 110: 28-35.
[14] Monsalve J J, Baggett J, Bishop R, et al. Application of laser scanning for rock mass characterization and discrete fracture network generation in an underground limestone mine [J]. International Journal of Mining Science and Technology, 2019, 29(1): 131-137.
[15] Kedzierski M, Fryskowska A. Methods of laser scanning point clouds integration in precise 3d building modelling [J]. Measurement, 2015, 74: 221-232.
[16] Li Hanzhi. Parameter Optimization and Experimental Study of Blasting Excavation inCoal Mine Rock Tunnels [J]. Shanxi Chemical Industry, 2024, 44(7): 192-194.
[17] LIU Yuan. Application and practice of safe and efficient recovery technology for residual ore and bottom pillar at the bottom of goaf in a polymetallic mine [J]. Mining Technology 2024, 24(4): 108-111.
Cite This Article
  • APA Style

    Haoqiang, Z., Dake, L., Junwei, C., Lu, C. (2025). Research on Ore Loss and Dilution Control Based on Three-dimensional Visualization. American Journal of Energy Engineering, 13(2), 67-76. https://doi.org/10.11648/j.ajee.20251302.13

    Copy | Download

    ACS Style

    Haoqiang, Z.; Dake, L.; Junwei, C.; Lu, C. Research on Ore Loss and Dilution Control Based on Three-dimensional Visualization. Am. J. Energy Eng. 2025, 13(2), 67-76. doi: 10.11648/j.ajee.20251302.13

    Copy | Download

    AMA Style

    Haoqiang Z, Dake L, Junwei C, Lu C. Research on Ore Loss and Dilution Control Based on Three-dimensional Visualization. Am J Energy Eng. 2025;13(2):67-76. doi: 10.11648/j.ajee.20251302.13

    Copy | Download

  • @article{10.11648/j.ajee.20251302.13,
      author = {Zhang Haoqiang and Liu Dake and Chen Junwei and Chen Lu},
      title = {Research on Ore Loss and Dilution Control Based on Three-dimensional Visualization},
      journal = {American Journal of Energy Engineering},
      volume = {13},
      number = {2},
      pages = {67-76},
      doi = {10.11648/j.ajee.20251302.13},
      url = {https://doi.org/10.11648/j.ajee.20251302.13},
      eprint = {https://article.sciencepublishinggroup.com/pdf/10.11648.j.ajee.20251302.13},
      abstract = {The loss and dilution of ore are two important indicators in the evaluation of goaf operation. In order to more timely and accurately reflect the loss and dilution rate after the end of each stope mining, this paper uses BLSS-HL three-dimensional laser scanning system to scan two goafs (724 # -2,714 #) in a deep mining area of a gold mine, and establishes a three-dimensional visualization model. Based on the point cloud data of the two goafs obtained by scanning, the point cloud data of the two goafs are processed by Cloud Compare point cloud processing software. Based on the point cloud data, the 3DMine mining software was used to establish the solid model of the two goafs, and the loss and dilution index was calculated, so as to realize the visualization of the loss and dilution of the stope. The goaf volume of 724 # -2 stope is 15890.87m3, the dilution rate is 3.12%, and the loss rate is 16.59%. The goaf volume of 714 stope is 10266.22m3, the dilution rate is 27.21%, and the loss rate is 14.15%. Based on the empty area model, the depletion loss of the two stopes was analyzed. The blast hole profile of 724 # -2 stope is established, which provides a reference for the design of medium-deep hole low-depletion blasting in two-step stope.},
     year = {2025}
    }
    

    Copy | Download

  • TY  - JOUR
    T1  - Research on Ore Loss and Dilution Control Based on Three-dimensional Visualization
    AU  - Zhang Haoqiang
    AU  - Liu Dake
    AU  - Chen Junwei
    AU  - Chen Lu
    Y1  - 2025/06/26
    PY  - 2025
    N1  - https://doi.org/10.11648/j.ajee.20251302.13
    DO  - 10.11648/j.ajee.20251302.13
    T2  - American Journal of Energy Engineering
    JF  - American Journal of Energy Engineering
    JO  - American Journal of Energy Engineering
    SP  - 67
    EP  - 76
    PB  - Science Publishing Group
    SN  - 2329-163X
    UR  - https://doi.org/10.11648/j.ajee.20251302.13
    AB  - The loss and dilution of ore are two important indicators in the evaluation of goaf operation. In order to more timely and accurately reflect the loss and dilution rate after the end of each stope mining, this paper uses BLSS-HL three-dimensional laser scanning system to scan two goafs (724 # -2,714 #) in a deep mining area of a gold mine, and establishes a three-dimensional visualization model. Based on the point cloud data of the two goafs obtained by scanning, the point cloud data of the two goafs are processed by Cloud Compare point cloud processing software. Based on the point cloud data, the 3DMine mining software was used to establish the solid model of the two goafs, and the loss and dilution index was calculated, so as to realize the visualization of the loss and dilution of the stope. The goaf volume of 724 # -2 stope is 15890.87m3, the dilution rate is 3.12%, and the loss rate is 16.59%. The goaf volume of 714 stope is 10266.22m3, the dilution rate is 27.21%, and the loss rate is 14.15%. Based on the empty area model, the depletion loss of the two stopes was analyzed. The blast hole profile of 724 # -2 stope is established, which provides a reference for the design of medium-deep hole low-depletion blasting in two-step stope.
    VL  - 13
    IS  - 2
    ER  - 

    Copy | Download

Author Information
  • China Nonferrous Metals Int’l Mining Pakrut LLC, Beijing, China

  • China Nonferrous Metals Int’l Mining Pakrut LLC, Beijing, China

  • College of Resources and Safety Engineering, University of Science and Technology Beijing, Beijing, China

  • College of Resources and Safety Engineering, University of Science and Technology Beijing, Beijing, China