Research Article | | Peer-Reviewed

Aircraft Impact Response of Concrete Gravity Dams: A Finite Element Study

Received: 25 March 2026     Accepted: 9 May 2026     Published: 5 June 2026
Views:       Downloads:
Abstract

The safety of critical infrastructures like concrete gravity dams against high-strain dynamic loads has gained significant attention due to their strategic importance. This study presents a finite element analysis to evaluate the structural response of five differently shaped concrete gravity dam models under aircraft impact loading. A three-dimensional simulation was performed using the Finite Element Method (FEM), employing the Concrete Damaged Plasticity (CDP) model to accurately capture the nonlinear behavior of concrete under high-strain rates. The impact of a Phantom F4 aircraft impacting at a velocity of 215 m/s, simulated using Riera’s reaction-time force history, targeting the freeboard region of each dam model. Comparative analysis revealed that the maximum deformation (620 mm) and tensile damage were concentrated around the impact zone, particularly for Dam 1, while other dam geometries exhibited distributed stress patterns and lesser damage. Stress-time history plots demonstrated tensile dominance near the impact region and compressive dominance near the dam base. The findings indicate that dam geometry significantly influences the damage and stress distribution under aircraft impact, with certain profiles being more vulnerable. This research provides critical insights for the design and assessment of concrete gravity dams to enhance their resilience against potential high-energy impact scenarios.

Published in American Journal of Construction and Building Materials (Volume 10, Issue 1)
DOI 10.11648/j.ajcbm.20261001.12
Page(s) 5-19
Creative Commons

This is an Open Access article, distributed under the terms of the Creative Commons Attribution 4.0 International License (http://creativecommons.org/licenses/by/4.0/), which permits unrestricted use, distribution and reproduction in any medium or format, provided the original work is properly cited.

Copyright

Copyright © The Author(s), 2026. Published by Science Publishing Group

Keywords

Impact Loading, Finite Element Method, Concrete Damage Plasticity, Deformation, Tensile Damage

1. Introduction
Aircraft and missile impact on structures represent extreme dynamic loading conditions characterized by high strain rates and complex material behavior. The behavior of concrete structures under quasi-static and dynamic conditions has been analyzed by different researchers in the past using both experimental and numerical methods . High strain loading due to deformable and rigid projectiles had been studied separately. Sugano et al., performed an experimental program by hitting a concrete slab with a Phantom F4 aircraft and reported the behavior of concrete under the impact loading. Apart from this study, limited full-scale investigations are available for aircraft impact on concrete structures, However, a few small-scale analyses have also been reported . Nevertheless, numerical methods are extensively used by researchers to analyze the behavior of concrete structures under aircraft loading . Riera et al., and Abbas et al., subsequently developed the reaction time curve of an aircraft impact loading against a rigid target analytically and applied it to study the behavior of concrete structures. The Riera force–time history method is widely adopted for representing aircraft impact loading in numerical simulations due to its ability to simplify complex aircraft–structure interaction.
In the open literature, researchers have analyzed various concrete structures like Outer Containment Structures , reinforced concrete structures , NPPs (nuclear power plant) , buried concrete structures, runway pavement , Cooling tower under aircraft impact. However, there have been fewer studies available for high strain loading on concrete gravity dam mainly based on seismic loads. Thus, studies focusing on aircraft impact response of concrete gravity dams remain limited, particularly under high strain dynamic loading conditions. Dams have been considered an important strategic structure, storing the water for multipurpose development projects. Generally, it has been constructed to serve numerous amenities ranging from hydroelectric generation, irrigation, flood control, to recreation. Considering strategic and economic importance of the dam, its safety is immensely important against any static and dynamic loading condition. Nevertheless, the failure of a dam will not only be an economic loss, but it will also adversely affect vegetation and human life downstream due to flash floods. Moreover, it will create a water scarcity issue for the irrigation and population for several years . Hence, the safety analysis of dams against high strain loading is important to ensure its reliability and safety against such events.
Among the various safety measures employed, one is that dams should be structurally sound under high strain loading condition. In the current study this safety aspect of the dam has been studied. Concrete dams can also be a soft target for enemies and terrorist in case of conflict. In past, the German dams were bombed by Royal Airforce during World War II which caused catastrophic damage in the region. World Trade Centre incident in New York reveals the possibility of attacking a dam by an aircraft, hence, attracting the researcher’s attention in this field. These considerations highlight the need for focused numerical investigations that combine established impact loading models with advanced material modeling to assess the response of concrete gravity dams under aircraft impact scenarios.
Unlike previous studies that primarily focus on individual structural configurations, the present work introduces a parameterized geometric framework to systematically evaluate the influence of dam shape on impact response. By defining key geometric variables, the study aims to provide generalized insights into the role of dam geometry in governing deformation, stress distribution, and damage characteristics under aircraft impact loading. This study introduces a detailed parametric analysis involving five different dam geometries with varying freeboard thicknesses to assess their structural performance under aircraft impact loading. Using the Finite Element Method and adopting Riera’s reaction-time history approach for simulating aircraft loads, the research aims to systematically evaluate the influence of dam geometry on deformation patterns, stress distribution, and damage evolution. The primary objective of this work is to provide insights into the influence of geometric configuration on the structural response of concrete gravity dams subjected to high-energy impact loading. The study aims to develop a comparative understanding of deformation, stress distribution, and damage characteristics under consistent impact conditions, which may serve as a basis for future, more detailed investigations toward resilience enhancement of critical hydraulic structures.
2. Numerical Modelling
2.1. Finite Element and Geometrical Modelling
Numerical analyses were performed using the Finite Element Method. Three-dimensional models of typical concrete gravity dam monolith were developed through Abaqus CAE. The geometric parameters of all five models have been shown in Figure 1. The thickness of the dam monolith model has been 20m in all cases. As shown in Figure 1 models have different geometries (hence, the freeboard for different models is different) but the aircraft impact location has been kept at the middle of freeboard available in each case. The dam model was discretized in a consistent manner for all cases.
To ensure a systematic comparison among different dam configurations, the geometric variations considered in this study have been parameterized using key governing variables. These include the thickness of freeboard (Tf), crest width (Bc), base width (Bb), and the upstream and downstream face slopes. While the overall height of the dam is kept constant across all models, variations in these parameters lead to distinct geometric profiles. To facilitate a quantitative comparison, all five dam models have been characterized in terms of these parameters, as summarized in Table 1. This parameterization enables the identification of trends in structural response with respect to geometric variations, allowing the results to be interpreted beyond case-specific observations. To generalize the findings, non-dimensional geometric ratios such as Tf/H and Bb/H are also evaluated, enabling broader interpretation of the influence of geometry on impact response (see Table 2).
A three-dimensional, eight-noded reduced integration element (C3D8R) was used to model the dam body, as shown in Figure 2a. A mesh convergence study was performed in the defined impact region, in which the mesh was progressively refined and the corresponding maximum deformation at the impact location was monitored. It was observed that beyond an element size of 0.5 m, further refinement resulted in negligible variation in deformation (see Figure 2b). Therefore, an element size of 0.5 m was adopted within the 6 m diameter impact zone to ensure a balance between computational efficiency and accuracy. The rest of the dam body is meshed with relatively coarser elements to optimize the total number of elements in the model. Table 3 shows the number of elements for all the geometries. The analysis was performed in two steps: a static general step followed by a dynamic explicit step in the Abaqus module.
Table 1. Geometric parameters of dam models.

Dam Model

Height H (m)

Base Width Bb (m)

Crest Width Bc (m)

Freeboard Thickness Tf (m)

Upstream Face

Downstream Face

Dam 1

52.72

42.3

4.88

4.27

Inclined

Steep inclined

Dam 2

103

70

14.8

36.5

Vertical

Inclined

Dam 3

122

96.8

9.80

8.2

Slight incline

Inclined

Dam 4

197

215

14

13

Stepped

Inclined

Dam 5

235

262.5

10

10

Vertical + kink

Inclined

Table 2. Non-dimensional geometric parameters of dam models (freeboard thickness ratio Tf/H and base width ratio Bb/H).

Dam

Tf/H

Bb/H

Dam 1

0.081

0.80

Dam 2

0.35

0.68

Dam 3

0.067

0.79

Dam 4

0.066

1.09

Dam 5

0.043

1.12

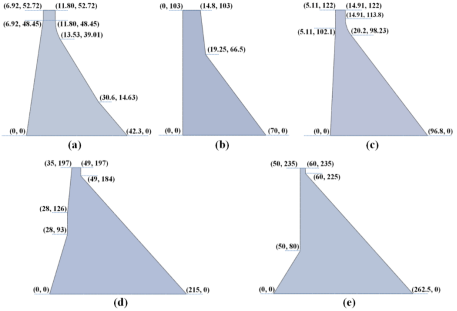
Figure 1. Details of different shapes of dam (a) Dam 1 (b) Dam 2 (c) Dam 3 (d) Dam 4 (e) Dam 5.
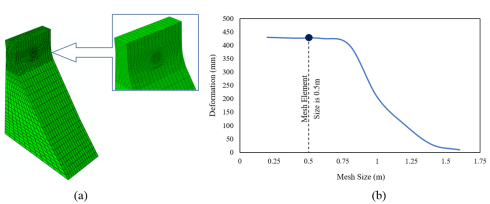
Figure 2. Details of meshing (a) Discretization of model (b) Mesh convergence study in dam model at the point of impact.
Table 3. Number of elements in each model of dam.

Dam Model

Number of elements

Dam 1

10956

Dam 2

8480

Dam 3

8884

Dam 4

7424

Dam 5

10400

2.2. Material Characteristics
The structural behavior of the model strongly depends on the assigned material model; different material models can be utilized in the finite element solvers. To perform a precise finite element analysis, the material characteristic must be problem oriented. For behavior of concrete under high strain loading, concrete damage and plasticity are the two main factors on which structural behavior of concrete has been studied. In Abaqus, Concrete Damaged plasticity (CDP) Model has been extensively used by researchers for simulating high strain loading on concrete structures . The CDP model is a modified form of Drucker-Pager strength hypothesis . The CDP model has the ability to incorporate both the plain and the reinforced concrete structures under high strain loading conditions. The main failure mechanism in CDP depends on compression crushing and tensile cracking failures. Moreover, out of all available concrete models in Abaqus, CDP provides highest accuracy in results and most appropriate for impact problems .
It is important to note that although the present study involves high-strain dynamic loading due to aircraft impact, strain-rate effects have not been explicitly incorporated in the constitutive model through Dynamic Increase Factors (DIF). The primary aim of the study is to investigate the influence of geometric configuration on structural response. Therefore, a rate-independent formulation of the CDP model has been adopted to ensure consistency in comparative analysis across all dam geometries. This assumption is consistent with several numerical studies focusing on relative structural performance under impact loading. The CDP model accounts for material degradation through scalar damage variables in tension (dt) and compression (dc), which represent stiffness degradation due to cracking and crushing, respectively. The evolution of damage is governed by the stress–strain relationships in tension and compression, as defined in the model. In the tensile regime, damage initiates after reaching the tensile strength and evolves with increasing cracking displacement, representing crack propagation. In compression, damage evolves beyond peak compressive stress, reflecting crushing behavior.
The tensile behavior of concrete is defined using parameters such as tensile strength (st) and cracking displacement (Uto). The cracking displacement represents the displacement at complete loss of tensile stress transfer across a crack and is related to the fracture energy of concrete. These parameters control the post-peak softening response in tension and play a critical role in capturing crack initiation and propagation under impact loading within the Abaqus CDP framework. A small viscosity parameter is implicitly considered in the CDP model to improve numerical convergence and stability in dynamic explicit simulations. This regularization helps to mitigate convergence issues associated with strain localization and softening behavior, without significantly affecting the overall structural response. It should be noted that element deletion or erosion techniques have not been employed in the present study. Instead, material failure is represented through progressive stiffness degradation using the damage variables of the CDP model. This approach allows continuous tracking of damage evolution without introducing numerical instabilities associated with element removal.
In the present study, CDP model has been used to simulate the structural responses of concrete gravity dam due to its versatility. The CDP is plasticity damage material model, yielding in concrete is achieved by isotropic damage elasticity in combination of isotropic tensile and compressive plasticity.
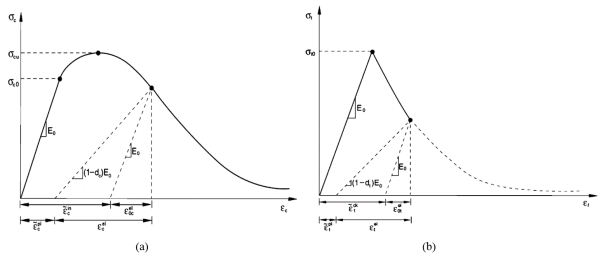
Figure 3. Stress-strain relation in CDP (a) Tension (b) Compression.
The final yield surface has been defined by two hardening parameters εc~pland εt~pl. These are equivalent plastic-strains of concrete in compression and tension, respectively. The The CDP model follows a linear stress–strain distribution under uniaxial tension until failure occurs. Figure 3(a) shows stress-strain relation under uniaxial tension and Figure 3(b) under uniaxial compression. Post failure for uniaxial tension concrete experience softening stress-strain response. The stress-strain relation for uniaxial compression is linear till initial compressive strength reaches, in plastic region strain hardening occurs until the ultimate compressive strength is reached. Beyond that strain-softening happens. The stress-strain relations of CDP model are governed by equation (1) and equation (2) for uniaxial tension and uniaxial compression respectively, where dt and dc are tension and compression damage variables, respectively. The Material parameters used for the present study are shown in Table 4 . The stress–strain relationships and corresponding damage evolution laws used in the CDP model are illustrated in Figure 4(a-b) .
σt=1-dtE0εt-εt~pl(1)
σt=1-dtE0εt-εt~pl(2)
Table 4. Material properties for concrete modelling .

Concrete Density (ρ)

2400 kg/m3

Modulus of Elasticity €

27.386 Gpa

Poisson’s Ratio (ν)

0.17

Dilation Angle (ψ)

30

Eccentricity

1.0

Initial Equi-biaxial Compressive Yield Stress to Initial Uniaxial Compressive Yield Stress (fb0 / fc0)

1.16

Shape Factor (K)

0.666

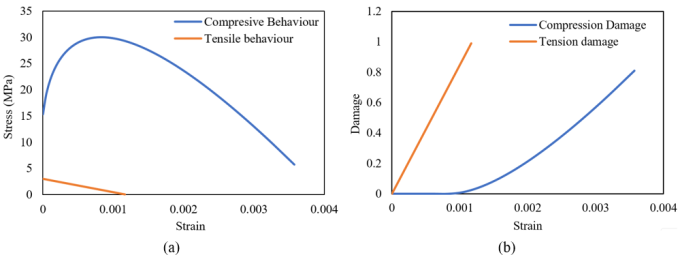
Figure 4. CDP constitutive behavior (a) stress–strain curves (compression and tension) (b) damage evolution (dc and dt) .
2.3. Loading and Boundary Conditions
The dynamic analysis was performed using the Abaqus/Explicit solver, where numerical stability is governed by the critical time step. The simulations were carried out with automatically controlled time increments satisfying the stability criterion. In addition, the energy balance was carefully monitored throughout the analysis. The ratio of artificial energy to total internal energy remained within acceptable limits, indicating that the numerical solution was stable and free from significant non-physical effects.
The major forces acting on a concrete gravity dam are Gravity, Hydrostatic pressure, uplift pressure, wind pressure, and in some cases silt pressure and ice pressure. These are the forces considered in the design of concrete gravity dams in general, however earthquake effects shall be considered according to the prescribed codal provisions. In the present study, no effect of uplift and wind pressure have been considered while gravity force and hydrostatic water pressure have been considered in the analysis (see Figure 5). The base of the dam is assumed to be rigid by applying an encastre boundary condition in all the analysis steps. It means at base nodes all degrees of freedom have been assumed zero values (U1 = U2 = U3 = UR1 = UR2 = UR3 = 0). The sides of dam geometry have been assigned roller support (see Figure 5).
Apart from the above-mentioned forces, the present study investigates the effect of aircraft impact loading on a concrete gravity dam. The impact load is modeled using Riera’s force–time history approach, which represents the equivalent force generated by a deformable aircraft striking a rigid target, thereby avoiding the need for explicit modeling of complex aircraft geometry.
In this study, a Phantom F4 fighter jet impacting at a velocity of 215 m/s is considered for all simulations. The corresponding Riera force–time history curve is adopted from established literature and is shown in Figure 6, where curves for different velocities are presented. Among these, the 215 m/s curve is used in the present analysis to ensure consistency across all dam models.
The impact load is applied over a circular area of 6 m diameter located at the freeboard region of the dam. The force–time history is implemented in Abaqus/Explicit as a time-dependent distributed load, where the total force obtained from the Riera curve is converted into equivalent pressure over the defined impact area. The selected velocity is consistent with commonly adopted values in the literature for impact assessment of critical infrastructure.
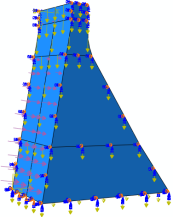
Figure 5. Boundary condition and applied forces.
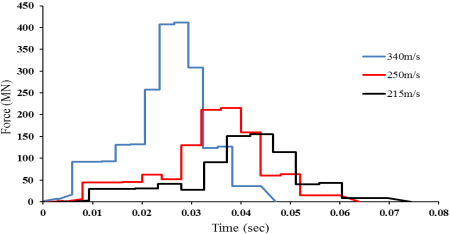
Figure 6. Reaction time response curves for Phantom F4 aircraft at different velocities (the curve corresponding to 215 m/s is adopted in the present study).
3. Validation
This section focuses on validating the finite element model to ensure the accuracy of the numerical simulation using Abaqus/Explicit. In this study, validation is conducted by comparing the numerical results with previous experimental findings related to impact loads. To validate the current finite element simulation under impact loading, numerical results were compared with those from a previous experiment carried out by Andersson . The numerical results were compared with experimental results, as shown in Table 5. A steel mass weighing 600 kg was used for the impact loading on a 0.2 m x 0.2 m area at the center of a concrete slab. The height from which the mass was dropped varied between 1 m and 2 m onto a concrete slab that measured 1.75 m x 1.75 m and had a thickness of 0.12 m. The dimensions of the slab, loading conditions, and material modeling were adopted in accordance with the report by Andersson .
It is acknowledged that the selected validation case, involving impact on a reinforced concrete slab, represents a simplified structural system compared to the large-scale and complex behavior of concrete gravity dams subjected to aircraft impact. In particular, the validation does not explicitly account for Riera-type distributed loading, large structural mass effects, or full-scale damage evolution in massive hydraulic structures.
Nevertheless, the adopted approach is consistent with several previous numerical studies, where validation against benchmark impact problems is used to establish confidence in the modeling framework. The present study is primarily intended as a comparative parametric analysis, and therefore the same validated modeling approach is consistently applied across all dam configurations to ensure meaningful relative comparisons.
Table 5. Comparison of experimental and numerical results for RC slab under impact load.

Slab Number

Height of Impact Load (m)

Experimental Displacement in Slab

(mm)

Numerical Displacement in Slab (mm)

Percentage Error in Displacement (%)

4

1.0

46

42.62

7.35

5

1.5

63

58.92

6.48

6

1.5

50

48.81

2.38

8

1.0

60

56.24

6.27

9

1.2

61

58.91

3.43

10

2.0

77

73.02

5.17

Average Error

5.18

4. Results and Discussion
A comparative numerical investigation has been conducted to evaluate the response of five different concrete gravity dam geometries subject to the impact of a Phantom F4 aircraft. Three-dimensional finite element analyses were performed using the Abaqus software for each dam configuration. The impact scenario assumes that the aircraft collides with the upstream freeboard region at a velocity of 215 m/s. The study focuses on evaluating the impact-induced deformation, damage patterns, and stress distribution within the dam structures.
To enhance the general applicability of the results, the structural response of the dam models is interpreted in terms of governing geometric parameters rather than individual configurations alone. The geometric characteristics of the dams, including height (H), base width (Bb), crest width (Bc), and freeboard thickness (Tf), are expressed in both dimensional and non-dimensional forms. In particular, the ratios Tf/H and Bb/H are used to systematically evaluate the influence of geometry on impact response.
The comparison reveals that dams with relatively lower freeboard thickness ratios (Tf/H) tend to exhibit higher localized deformation and tensile damage near the impact region. For instance, Dam 1, which has a relatively small Tf/H ratio, shows the maximum deformation of approximately 620 mm, indicating reduced resistance to high-energy impact loading. In contrast, dam configurations with higher Tf/H ratios demonstrate improved distribution of stresses and comparatively lower localized damage. Similarly, the base width ratio (Bb/H) influences the overall stress distribution within the dam body. Dams with larger Bb/H ratios tend to exhibit better stress dispersion towards the downstream region, thereby reducing stress concentration near the impact zone. This behavior is evident in Dam 4 and Dam 5, where relatively higher Bb/H ratios correspond to lower stress magnitudes and reduced tensile damage. Furthermore, the variation in upstream and downstream face profiles contributes to differences in load transfer mechanisms under impact loading. Dams with inclined downstream faces facilitate gradual stress redistribution, whereas configurations with abrupt geometric transitions tend to concentrate stresses locally.
The five dam models are designated as (a) Dam 1, (b) Dam 2, (c) Dam 3, (d) Dam 4, and (e) Dam 5. Figure 7 illustrates the deformation contours at the dam crest along the direction of impact. The results reveal that the most significant deformation occurs in the vicinity of the freeboard impact zone, with Dam 1 exhibiting the highest displacement magnitude of approximately 620 mm. Minimal deformation is observed near the dam base in all cases, indicating localized damage confined primarily to the impact region.
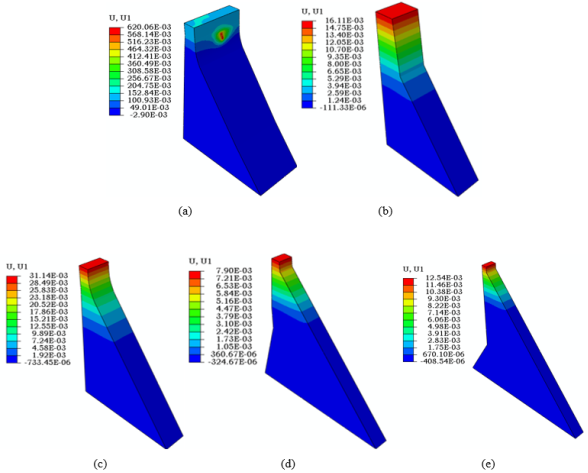
Figure 7. Deformation along the direction of impact of all shape dam models (a) Dam 1 (b) Dam 2 (c) Dam 3 (d) Dam 4 (e) Dam 5.
Figure 8 presents the contours of equivalent (von Mises) stress for all five dam models. The maximum equivalent stress, with a magnitude of 20.45 MPa, is observed in Dam 1. In contrast to the other dam models, where stress is more widely distributed throughout the dam body, Dam 1 exhibits a distinct stress concentration localized near the impact region. This indicates a more severe structural response in Dam 1 compared to the other configurations.
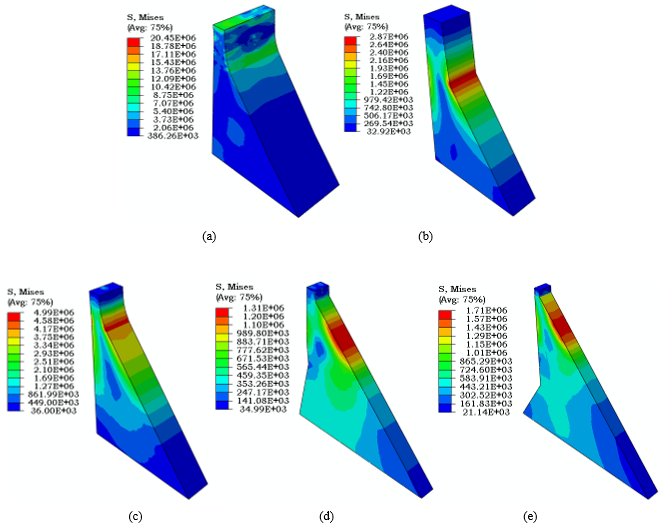
Figure 8. Contour of von mises stresses (a) Dam 1 (b) Dam 2 (c) Dam 3 (d) Dam 4 (e) Dam 5.
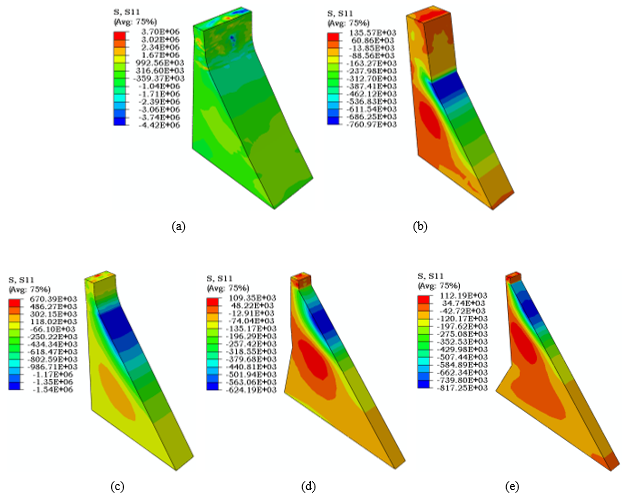
Figure 9. Principal stresses along the direction of impact (a) Dam 1 (b) Dam 2 (c) Dam 3 (d) Dam 4 (e) Dam 5.
Figure 9 illustrates the stress contours along the direction of impact. Dam 1 exhibits the highest compressive and tensile stresses, with peak values of 3.70 MPa and 4.42 MPa, respectively. These stresses are predominantly concentrated near the crest region of Dam 1. In contrast, for the other dam models, the stresses are more widely distributed along the downstream portion of the structure rather than being localized near the impact zone. Additionally, tensile stresses are observed near the neck of the freeboard on the downstream side in all models except Dam 1.
Figure 10 presents the maximum principal stress contours for all dam models. The distribution of principal stresses exhibits a trend consistent with the equivalent stress and directional stress results shown in Figures 7 and 8. Tensile stresses are predominant throughout the dam bodies in all geometries, except at the immediate impact zone, where compressive behavior is observed. The highest principal stress, with a magnitude of 15.6 MPa, is recorded in Dam 1, while Dam 4 experiences the lowest principal stress, measuring only 0.7 MPa. An important parameter in assessing the behavior of reinforced concrete structures in the Abaqus module is the concrete tensile damage, which provides insight into crack initiation and propagation under dynamic loading.
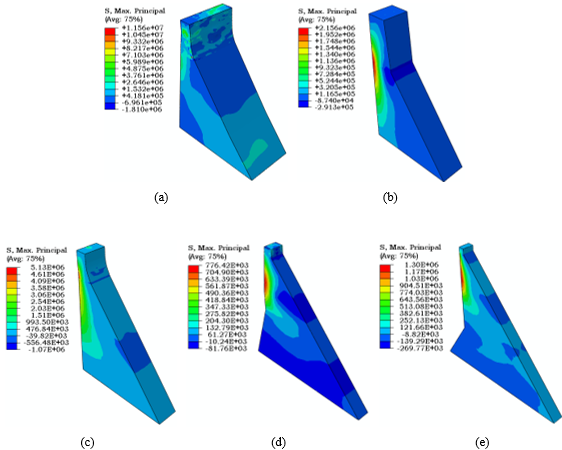
Figure 10. Maximum Principal Stresses (a) Dam 1 (b) Dam 2 (c) Dam 3 (d) Dam 4 (e) Dam 5.
Figure 11 displays the contours of the concrete tensile damage parameter for the different dam geometries. In the Abaqus simulation framework, concrete is considered to undergo tensile damage when the damage parameters dt (tensile) or dc (compressive) reach a value of 0.99. Among all the models, Dam 1 exhibits the maximum tensile damage with a value of 0.99, indicating severe material degradation at the impact zone. In contrast, Dam 3 shows no tensile damage, with a recorded value of zero. The remaining models exhibit localized tensile damage primarily concentrated along the direction of impact.
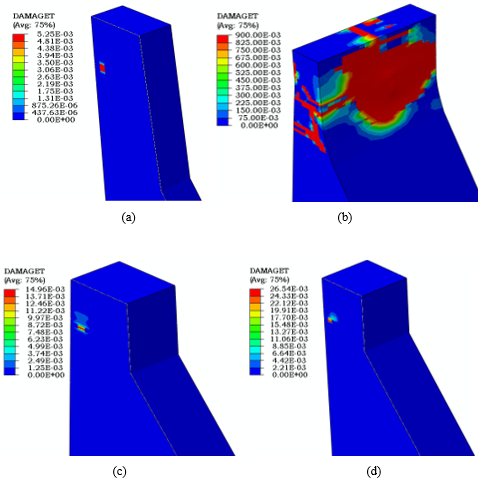
Figure 11. Tension damage in the freeboard of dams (a) Dam 1 (b) Dam 2 (c) Dam 4 (d) Dam 5.
Stress–time histories have been generated for two distinct locations: (1) along the impact region and (2) along the dam base, as indicated in Figure 12. At each location, stresses in all three principal directions, S11 (x-direction), S22 (y-direction), and S33 (z-direction), have been evaluated. The corresponding stress–time curves are presented in Figures 13 and 14 for the impact region and base, respectively. Figure 13 reveals that tensile stresses dominate along the impact direction, whereas compressive stresses are predominant at the dam base, as shown in Figure 14. Among all dam geometries, Dam 1 exhibits the highest stress magnitudes at both locations. In contrast, Dam 4 and Dam 5 demonstrate the lowest stress responses across all evaluated directions.
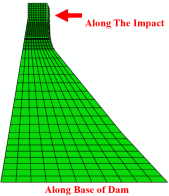
Figure 12. Positions along which stress vs time curves are plotted.
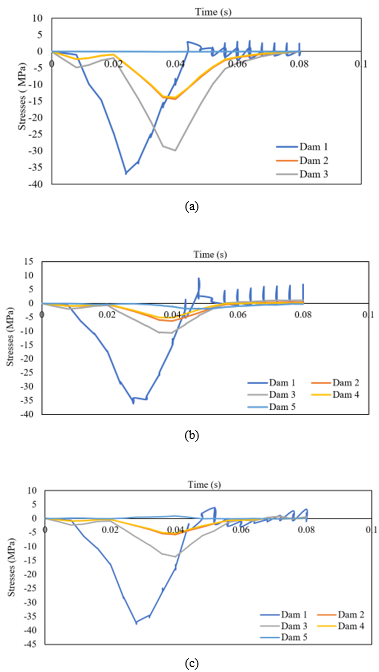
Figure 13. Stress-time plots along the direction of impact (a) S11 (b) S22 (c) S33.
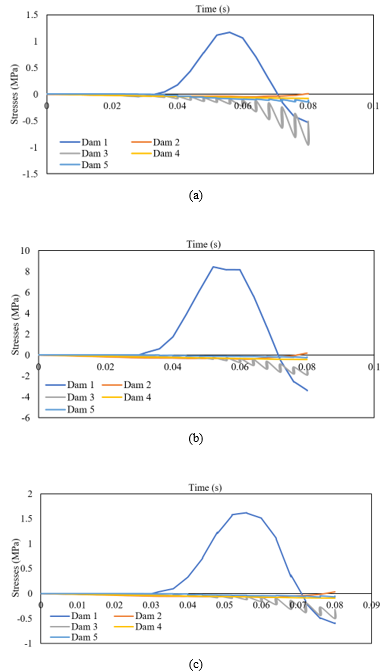
Figure 14. Stress-time plot along the base of the dam (a) S11 (b) S22 (c) S33.
A quantitative comparison of key response parameters is presented in Table 6, based on values extracted from the finite element contour results. It is observed that Dam 1 exhibits significantly higher displacement (~620 mm) and stress levels (~20.45 MPa), indicating greater vulnerability under the given impact conditions. In contrast, Dam 4 shows the lowest response across all parameters, while Dam 2, Dam 3, and Dam 5 demonstrate intermediate behavior with comparatively more distributed stress patterns. These results clearly highlight the influence of geometric configuration on the structural response of concrete gravity dams under aircraft impact loading.
Table 6. Quantitative comparison of structural response.

Dam

Max Displacement (mm)

Max Principal Stress (MPa)

Von Mises Stress (MPa)

Remarks

Dam 1

620.06

11.56

20.45

Highest deformation and stress concentration

Dam 2

16.11

2.16

2.87

Localized stress at impact zone

Dam 3

31.14

5.13

4.99

Moderate stress distribution

Dam 4

7.90

0.78

1.31

Lowest stress and deformation

Dam 5

12.54

1.30

1.71

Distributed stress pattern

5. Conclusion
A three-dimensional finite element-based comparative parametric study has been carried out to evaluate the response of five concrete gravity dam geometries subjected to aircraft impact loading using Riera’s force–time history approach. A Phantom F4 aircraft impact at a velocity of 215 m/s has been considered.
The main findings and their engineering implications are summarized as follows:
1) Maximum deformation is concentrated near the impact region for all dam geometries, with Dam 1 exhibiting the highest displacement (approximately 620 mm), indicating greater vulnerability of this configuration to localized impact loading.
2) Tensile damage is primarily localized along the impact zone. Dam 1 shows severe damage, while Dam 3 exhibits negligible damage, suggesting that geometric configuration significantly influences crack initiation and propagation.
3) The stress distribution shows that tensile stresses dominate near the impact region, whereas compressive stresses are more significant near the dam base. Dam 1 experiences the highest stress magnitudes, while Dam 4 and Dam 5 show comparatively lower and more distributed stress patterns, indicating improved structural response.
4) The results demonstrate that geometric configuration plays a crucial role in governing deformation, stress distribution, and damage behavior under aircraft impact loading.
5) Dam geometries like Dam 1 are more susceptible to localized damage, whereas configurations like Dam 4 and Dam 5 exhibit comparatively better performance, suggesting that optimized geometric profiles can enhance impact resistance.
6) The study presented here provides preliminary insights into the influence of geometric configuration on the response of concrete gravity dams subjected to aircraft impact loading. The findings highlight important trends in deformation, stress distribution, and damage characteristics under the adopted loading scenario.
Abbreviations

FEM

Finite Element Method

CDP

Concrete Damaged Plasticity

DIF

Dynamic Increase Factor

Tf

Freeboard Thickness

Bb

Base Width

Bc

Crest Width

H

Height of Dam

Acknowledgments
The authors are thankful to the Department of Civil Engineering, Zakir Hussain College of Engineering and Technology, Aligarh Muslim University, India for providing the computational assistance (Abaqus).
Author Contributions
Ibraheem Rais: Formal Analysis, Software, Validation, Writing – review & editing
Mohammad Faraz Athar: Conceptualization, Software, Writing – original draft
Aklilu Shitu: Formal Analysis, Writing – review & editing
Md. Imteyaz Ansari: Methodology, Supervision, Writing – review & editing
Md. Rehan Sadique: Formal Analysis, Software, Writing – review & editing
Data Availability Statement
The datasets used and analysed during the current study are available from the corresponding author on reasonable request.
Conflicts of Interest
The authors declare no competing interests.
References
[1] Ansari, M. A., Rais, I., Sadique, M. R., & Samanta, M. (2025a). Numerical Analysis of Cut-and-Cover Tunnels Under Surface Blast Loads and Mitigation Strategies. Transportation Infrastructure Geotechnology, 12(3), 1-37.
[2] Ansari, A., Rehan Sadique, M., Rais, I., & Masroor Alam, M. (2025b). Comprehensive study of twin tunnel-soil-structure interaction: geostatic, superstructure, and seismic effects. Multiscale and Multidisciplinary Modeling, Experiments and Design, 8(3), 203.
[3] Shitu, A., Shitu, E. & Rais, I. (2025). Deformation Behavior of Cross-Passage Tunnel in Weak Soils: A Parametric Study Based on Advanced Soil Models. Transp. Infrastruct. Geotech. 12, 219.
[4] Rais, I., Ansari, M. A., Sadique, M. R., Ansari, M. M., Alam, T., & Dobrota, D. (2025). Finite Element Modelling and Analysis of Sustainable Safety Bunkers in War Zones. Sustainable and Resilient Infrastructure.
[5] Alsabhan, A., Rais, I., Sadique, M. R., Mohammad, Z., Alam, S., & Binyahya, A. S., Qadri, J. (2025). Impact of Large Tunnel Construction on Existing Small Tunnels in Soft Ground: A Multi-Method Analysis. Advances in Civil Engineering.
[6] Khan, J. A., Rais, I., Sadique, M. R., & Alam, M. M. (2025). Numerical analysis of underground tunnels in various soil types under surface blast loading: a parametric study on damage, settlement, and safe depth. Journal of Building Pathology and Rehabilitation, 10(1), 70.
[7] Sugano, T., Tsubota, H., Kasai, Y., Koshika, N., Ohnuma, H., Von Riesemann, W. A.,... & Parks, M. B. (1993). Local damage to reinforced concrete structures caused by impact of aircraft engine missiles Part 1. Test program, method and results. Nuclear Engineering and design, 140(3), 387-405.
[8] Wen, L. J., Zhang, C. M., Guo, C., Zhang, L. S., Ou, Z. C., & Duan, Z. P. (2018). Dynamic responses of a steel-reinforced concrete target impacted by aircraft models. International Journal of Impact Engineering, 117, 123-137.
[9] Sadiq, M., Yun, Z. X., & Rong, P. (2014). Simulation analysis of impact tests of steel plate reinforced concrete and reinforced concrete slabs against aircraft impact and its validation with experimental results. Nuclear Engineering and Design, 273, 653-667.
[10] Omika, Y., Fukuzawa, E., Koshika, N., Morikawa, H., & Fukuda, R. (2005). Structural responses of World Trade Center under aircraft attacks. Journal of Structural Engineering, 131(1), 6-15.
[11] Arros, J., & Doumbalski, N. (2007). Analysis of aircraft impact to concrete structures. Nuclear engineering and design, 237(12-13), 1241-1249.
[12] Hong, J. K., & Kang, T. H. K. (2018). Computing in protection engineering: CFD analysis of blade fragment impact on concrete wall. Journal of Structural Integrity and Maintenance, 3(4), 210-216.
[13] Riera, J. D. (1968). On the stress analysis of structures subjected to aircraft impact forces. Nuclear Engineering and Design, 8(4), 415-426.
[14] Abbas, H., Paul, D. K., Godbole, P. N., & Nayak, G. C. (1996). Aircraft crash upon outer containment of nuclear power plant. Nuclear Engineering and Design, 160(1-2), 13-50.
[15] Zhang, T., Wu, H., Fang, Q., & Huang, T. (2017). Numerical simulations of nuclear power plant containment subjected to aircraft impact. Nuclear Engineering and Design, 320, 207-221.
[16] Shitu, A., & Shitu, E. (2025). Volcanic scoria as a sustainable alternative to sand in structural lightweight concrete. Scientific Reports, 15(1), 34431.
[17] Riera, J. D. (1980). A critical reappraisal of nuclear power plant safety against accidental aircraft impact. Nuclear Engineering and Design, 57(1), 193-206.
[18] Frano, R. L., & Forasassi, G. (2012). Preliminary evaluation of the seismic response of the ELSY LFR. Nuclear engineering and design, 242, 361-368.
[19] Lo Frano, R. (2021). Aircraft impact effects on an aged NPP. Materials, 14(4), 816.
[20] Ali, S., Fawzia, S., Thambiratnam, D., Liu, X., & Remennikov, A. M. (2020). Performance of protective concrete runway pavement under aircraft impact loading. Structure and Infrastructure Engineering, 16(12), 1698-1710.
[21] Tang, J. J., Wu, H., Ke, S. T., & Fang, Q. (2019). Numerical simulations of a large-scale cooling tower against the impact of commercial aircrafts. Thin-Walled Structures, 144, 106367.
[22] Wang, G., & Zhang, S. (2014). Damage prediction of concrete gravity dams subjected to underwater explosion shock loading. Engineering failure analysis, 39, 72-91.
[23] Zhang, S., Wang, G., Wang, C., Pang, B., & Du, C. (2014). Numerical simulation of failure modes of concrete gravity dams subjected to underwater explosion. Engineering Failure Analysis, 36, 49-64.
[24] Wang, M., Chen, J., Wei, H., & Song, B. (2019). Experimental investigation of a small-scaled model for overflow section of a high gravity dam on shaking table. Advances in Mechanical Engineering, 11(2),
[25] Gupta, H. K. (1985). The present status of reservoir induced seismicity investigations with special emphasis on Koyna earthquakes. Tectonophysics, 118(3-4), 257-279.
[26] Lyu, Z., Chai, J., Xu, Z., Qin, Y., & Cao, J. (2019). A comprehensive review on reasons for tailings dam failures based on case history. Advances in Civil Engineering, 2019(1), 4159306.
[27] Sinha, B. P., Gerstle, K. H., & Tulin, L. G. (1964, February). Stress-strain relations for concrete under cyclic loading. In Journal Proceedings (Vol. 61, No. 2, pp. 195-212).
[28] Hillerborg, A., Modéer, M., & Petersson, P. E. (1976). Analysis of crack formation and crack growth in concrete by means of fracture mechanics and finite elements. Cement and concrete research, 6(6), 773-781.
[29] Chaudhari, S. V., & Chakrabarti, M. A. (2012). Modeling of concrete for nonlinear analysis using finite element code ABAQUS. International Journal of Computer Applications, 44(7), 14-18.
[30] Xotta, G., Beizaee, S., & Willam, K. J. (2014). Localization analysis of coupled plasticity and damage models for dissipative materials. Computational Modelling of Concrete Structures, 439.
[31] Iqbal, M. A., Sadique, M. R., Bhargava, P., & Bhandari, N. M. (2014). Damage assessment of nuclear containment against aircraft crash. Nuclear Engineering and Design, 278, 586-600.
[32] Raza, A., Khan, Q. U. Z., & Ahmad, A. (2019). Numerical Investigation of Load‐Carrying Capacity of GFRP‐Reinforced Rectangular Concrete Members Using CDP Model in ABAQUS. Advances in Civil Engineering, 2019(1), 1745341.
[33] Martin, O. (2010). Comparison of different constitutive models for concrete in ABAQUS/explicit for missile impact analyses. JRC Scientific and Technical Reports.
[34] Lu, Y., & Xu, K. (2004). Modelling of dynamic behaviour of concrete materials under blast loading. International Journal of Solids and Structures, 41(1), 131-143.
[35] Hafezolghorani, M., Hejazi, F., Vaghei, R., Jaafar, M. S. B., & Karimzade, K. (2017). Simplified damage plasticity model for concrete. Structural engineering international, 27(1), 68-78.
[36] Andersson, A. (2014). Impact loading on concrete slabs: Experimental tests and numerical simulations.
Cite This Article
  • APA Style

    Rais, I., Athar, M. F., Shitu, A., Ansari, M. I., Sadique, M. R. (2026). Aircraft Impact Response of Concrete Gravity Dams: A Finite Element Study. American Journal of Construction and Building Materials, 10(1), 5-19. https://doi.org/10.11648/j.ajcbm.20261001.12

    Copy | Download

    ACS Style

    Rais, I.; Athar, M. F.; Shitu, A.; Ansari, M. I.; Sadique, M. R. Aircraft Impact Response of Concrete Gravity Dams: A Finite Element Study. Am. J. Constr. Build. Mater. 2026, 10(1), 5-19. doi: 10.11648/j.ajcbm.20261001.12

    Copy | Download

    AMA Style

    Rais I, Athar MF, Shitu A, Ansari MI, Sadique MR. Aircraft Impact Response of Concrete Gravity Dams: A Finite Element Study. Am J Constr Build Mater. 2026;10(1):5-19. doi: 10.11648/j.ajcbm.20261001.12

    Copy | Download

  • @article{10.11648/j.ajcbm.20261001.12,
      author = {Ibraheem Rais and Mohammad Faraz Athar and Aklilu Shitu and Md. Imteyaz Ansari and Md. Rehan Sadique},
      title = {Aircraft Impact Response of Concrete Gravity Dams: 
    A Finite Element Study},
      journal = {American Journal of Construction and Building Materials},
      volume = {10},
      number = {1},
      pages = {5-19},
      doi = {10.11648/j.ajcbm.20261001.12},
      url = {https://doi.org/10.11648/j.ajcbm.20261001.12},
      eprint = {https://article.sciencepublishinggroup.com/pdf/10.11648.j.ajcbm.20261001.12},
      abstract = {The safety of critical infrastructures like concrete gravity dams against high-strain dynamic loads has gained significant attention due to their strategic importance. This study presents a finite element analysis to evaluate the structural response of five differently shaped concrete gravity dam models under aircraft impact loading. A three-dimensional simulation was performed using the Finite Element Method (FEM), employing the Concrete Damaged Plasticity (CDP) model to accurately capture the nonlinear behavior of concrete under high-strain rates. The impact of a Phantom F4 aircraft impacting at a velocity of 215 m/s, simulated using Riera’s reaction-time force history, targeting the freeboard region of each dam model. Comparative analysis revealed that the maximum deformation (620 mm) and tensile damage were concentrated around the impact zone, particularly for Dam 1, while other dam geometries exhibited distributed stress patterns and lesser damage. Stress-time history plots demonstrated tensile dominance near the impact region and compressive dominance near the dam base. The findings indicate that dam geometry significantly influences the damage and stress distribution under aircraft impact, with certain profiles being more vulnerable. This research provides critical insights for the design and assessment of concrete gravity dams to enhance their resilience against potential high-energy impact scenarios.},
     year = {2026}
    }
    

    Copy | Download

  • TY  - JOUR
    T1  - Aircraft Impact Response of Concrete Gravity Dams: 
    A Finite Element Study
    AU  - Ibraheem Rais
    AU  - Mohammad Faraz Athar
    AU  - Aklilu Shitu
    AU  - Md. Imteyaz Ansari
    AU  - Md. Rehan Sadique
    Y1  - 2026/06/05
    PY  - 2026
    N1  - https://doi.org/10.11648/j.ajcbm.20261001.12
    DO  - 10.11648/j.ajcbm.20261001.12
    T2  - American Journal of Construction and Building Materials
    JF  - American Journal of Construction and Building Materials
    JO  - American Journal of Construction and Building Materials
    SP  - 5
    EP  - 19
    PB  - Science Publishing Group
    SN  - 2640-0057
    UR  - https://doi.org/10.11648/j.ajcbm.20261001.12
    AB  - The safety of critical infrastructures like concrete gravity dams against high-strain dynamic loads has gained significant attention due to their strategic importance. This study presents a finite element analysis to evaluate the structural response of five differently shaped concrete gravity dam models under aircraft impact loading. A three-dimensional simulation was performed using the Finite Element Method (FEM), employing the Concrete Damaged Plasticity (CDP) model to accurately capture the nonlinear behavior of concrete under high-strain rates. The impact of a Phantom F4 aircraft impacting at a velocity of 215 m/s, simulated using Riera’s reaction-time force history, targeting the freeboard region of each dam model. Comparative analysis revealed that the maximum deformation (620 mm) and tensile damage were concentrated around the impact zone, particularly for Dam 1, while other dam geometries exhibited distributed stress patterns and lesser damage. Stress-time history plots demonstrated tensile dominance near the impact region and compressive dominance near the dam base. The findings indicate that dam geometry significantly influences the damage and stress distribution under aircraft impact, with certain profiles being more vulnerable. This research provides critical insights for the design and assessment of concrete gravity dams to enhance their resilience against potential high-energy impact scenarios.
    VL  - 10
    IS  - 1
    ER  - 

    Copy | Download

Author Information