2. Data and Methodology
2.1. Description of the Study Area
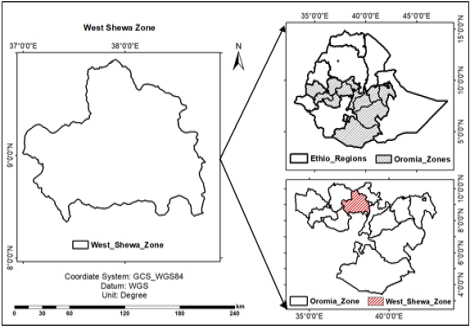
Figure 1. Map of the study area.
The study was conducted in the West Shewa Zone, located in the Oromia Regional State of Ethiopia, approximately 114 kilometers away from Addis Ababa, the nation's capital. Geographically, the zone lies between latitudes 8°17' and 9°56' N, and longitudes 37°17' and 38°45' E. It shares borders with the Amhara Regional State and North Shewa to the north, Addis Ababa City to the east, and West Wollega to the west (
Figure 1). The total area of the zone is approximately 15,086.15 square kilometers.
2.2. Data Sources, Processing, and Bias Correction
Rainfall observations from 1981 to 2014 were obtained from stations of the Ethiopian Meteorological Institute and the ENACT (Enhanced National Climate Services) dataset was used to fill the missing data. The Historical Data from 1981 to 2014, which serves as a baseline, and the Simulated Data for future estimates from 2030 to 2089 are the two separate periods covered by the CMIP6 datasets. The two periods for the future were the near-term (2030-2059) and the long-term (2060-2089) and simulated data were obtained from ESGF archives (https://esgf-node.llnl.gov/search/cmip6). The CMIP6 data sets collection was downloaded, extracted, and gridded using the Climate Data Tool (CDT) and Climate Data Operator (CDO). The CMIP6 data sets were remapped to a single 0.4°C x 0.4°C lat-lon grid using bilinear interpolation. To correct biases in the CMIP6 datasets, the CMhyd (Climate Model data for hydrologic modeling) tool was utilized. This tool was applied to adjust the climate model outputs, ensuring they more closely align with observed data through bias correction.
2.3. Method of Data Analysis
2.3.1. Mann-Kendall Trend Test
Rainfall trends were assessed using the Mann-Kendall trend test, a non-parametric technique less prone to outliers and evaluating meteorological elements without identifying linear or non-linear trends.
Kendall’s test statistic is given as xj -xi
(1)
The sign function given as
Where S is the Mann-Kendal’s test statistics; xi and xj are the sequential data values of the time series in the years j and j (j>i) and N is the length of the time series. A positive S value indicates an increasing trend and a negative value indicates a decreasing trend in the data series. Zs approximates the standard normal distribution and is computed as
Zs =(2)
The presence of a statistically significant trend will be evaluated using the Zs value. In the two-sided test for trend, the null hypothesis Ho should be accepted if | Zs | < Z1 - at a given level of significance. Z1 - is the critical value of Zs from the standard normal table - e.g.; for 5% significance level, the value of Z1 - is 1.96.
2.3.2. Sen’s Slope Estimator Test
The non-parametric method developed by Sen (1968), titled "Estimates of the Regression Coefficient Based on Kendall’s Tau" (J. Am. Stat. Assoc., 63, 1379-1389), was employed to estimate the magnitude of trends in the time series data. A negative Sen’s Slope value indicates a decreasing trend, while a positive value signifies an increasing trend.
2.3.3. The Coefficient of Variation (CV%)
The Coefficient of Variation is used to evaluate the variability of rainfall data relative to its standard deviation and is normally presented as a percentage.
Where CV is the coefficient of variation, δ is the standard deviation, and μ long-term mean rainfall. Based on CV values: CV < 20 indicates low variability, 20 ≤ CV ≤ 30 indicates moderate variability, and CV > 30 indicates high variability (Hare, 1983).
2.3.4. Rainfall Anomaly and Precipitation Concentration Index
Rainfall anomaly is a simple but effective tool that helps us understand changes in rainfall over time. By comparing actual rainfall to the long-term mean, we can see if a year is wetter or drier than usual. Positive rainfall anomalies indicate greater than long-term mean rainfall (wet year), while negative rainfall anomalies are less than long-term mean rainfall (dry year). Calculated by the formula:
The precipitation Concentration index (PCI) is used to describe the monthly rainfall distribution and values of less than 10 indicate the uniform (low concentration) monthly distribution of rainfall, 11-20 indicate moderate concertation, and above 21 indicates high concentration (Oliver, 1980). The rainfall anomaly and precipitation concentration index were calculated using precintcon package in R software. The precipitation Concentration Index is a useful tool for understanding how rainfall is distrbuted over the months by looking at the PCI values, and the patterns of rainfall. The formula helps to calculate PCI:
PCI =(5)
Where: = monthly rainfall (mm)
2.3.5. Future Precipitation Changes in Percent
Changes in mean rainfall for the near future (2030-2059) and far future (2060-2089) was calculated relative to the historical period (1981-2014), by calculating the difference between the historical mean and the projected mean for their respective periods, and calculating their percentage change, as follows:
Changes in Precipitation =(6)
2.3.6. Future Climate Projection
By generating climatic scenarios based on global patterns, general circulation models, or GCMs, are essential tools for modeling local climate trends. For regional and local applications, these models are frequently downscaled, yielding projections that are more precise for certain regions. CMhyd, a program built for hydrological modeling applications, has been used to accomplish the downscaling and bias correction of downscaled forecasts from CMIP6 (Coupled Model Intercomparison Project Phase 6) datasets using five distinct GCMs.
The study focused on assessing future rainfall patterns under two Shared Socioeconomic Pathways (SSPs). SSP2-4.5 represents a middle-of-the-road scenario characterized by moderate global development, partial implementation of sustainability policies, and persistent environmental challenges. In contrast, SSP5-8.5 reflects a high-emission scenario with minimal mitigation efforts, leading to severe climate impacts.
Table 1. Description of GCMs of Coupled Model Inter-comparison Project Phase 6.
Model names | Institution | Resolution |
BCC-CSM2-MR | Beijing Climate Center (BCC) and China Meteorological Administration (CMA), China | 1.13°× 1.13° |
MIROC6 | Atmosphere and Ocean Research Institute, University of Tokyo, Japan | 1.4°X 1.4° |
MRI-ESM2-0 | Meteorological Research Institute (MRI), Japan | 1.13°× 1.13° |
CNRM-CH6-1 | Centre National Recherches Meteorology (NRMC); Centre Européen de Recherches et de Formation Avancéeen Calcul Scientifique, France | 1.41°× 1.41° |
GFDL-ESM4 | Geophysical Fluid Dynamics Laboratory (GFDL), USA | 1.25°× 1.00° |
The study examines long and short-term projections and uses these models to evaluate the possible effects of rainfall changes in the area. To examine the projected rainfall in nine stations located in the West Shewa zone of Ethiopia, an ensemble approach employing bias-corrected data from different climate models and downscaling techniques was used.
Table 1 displays the GCMs of the Coupled Model Inter-comparison Project Phase (CMIP6) models that were used in this research study.
2.3.7. Analytical Procedure
After the CMIP6 data sets were downloaded in NetCDF (Network Common Data Form) format, the data sets collection was extracted using the Climate Data Tool (CDT) and regridded using Climate Data Operator (CDO). The CMIP6 data sets were remapped to a single 0.4°C x 0.4°C lat-lon grid using bilinear interpolation. The CMhyd (Climate Model data for hydrologic modeling) tool was used to correct for bias by converting the CMIP6 data sets' format into text. The CMIP6 data was prepared for analysis to compute trends or projections for rainfall changes in three periods: the near-term 2030-2059; the long-term period 2060-2089 and the baseline period 1981-2014. The daily rainfall of the research area was analyzed using Python and R Studio. Both descriptive and trend analysis were employed as methods of data analysis. R studio and Python were used to analyze the daily rainfall of the study area. Statistical descriptive techniques such as minimum, maximum, mean, standard deviation, P-value, Mann-Kendall test, anomaly rainfall index, precipitation concentration index, and rainfall outliers, as well as standard precipitation index, were calculated.
3. Results and Discussion
3.1. Data Processing and Presentation
3.1.1. Evaluation of CMIP6 Models Performance
The West Shewa zone's future rainfall forecasts from the CMIP6 models under various Shared Socioeconomic Pathways (SSPs) were evaluated. The evaluation process based on efficiency criteria from the "hydroGOF" R package, which is widely used in goodness-of-fit analyses and hydrological modeling. The models' ability to simulate precipitation was evaluated using a range of hydroGOF package statistical measures. Common measures included the Mean Absolute Error (MAE), Root Mean Square Error (RMSE), and Mean Error (ME). These criteria help assess how well the CMIP6 models capture the observed changes in regional climate. Their evaluation was carried out both temporally and geographically across complex topographical and climatic gradients
| [33] | F. Yazdandoost, S. Moradian, A. Izadi, and A. Aghakouchak, “Evaluation of CMIP6 precipitation simulations across different climatic zones: Uncertainty and model intercomparison,” Atmos. Res., vol. 250, p. 105369, 2021, https://doi.org/10.1016/j.atmosres.2020.105369 |
[33]
Selecting a General Circulation Model (GCM) indeed involves more considerations than only assessing a model's competence, bias, or performance using a single parameter. This is supported by the fact that the region, the period under study, and rainfall can all have a significant impact on how well GCMs function
| [34] | G. Fu, Z. Liu, S. P. Charles, Z. Xu, and Z. Yao, “A score-based method for assessing the performance of GCMs: A case study of southeastern Australia,” J. Geophys. Res. Atmos., vol. 118, no. 10, pp. 4154-4167, 2013, https://doi.org/10.1002/jgrd.50269 |
| [35] | M. M. Hamed, M. S. Nashwan, and S. Shahid, A novel selection method of CMIP6 GCMs for robust climate projection, vol. 42, no. 8. 2022. https://doi.org/10.1002/joc.7461 |
[34, 35]
Among the efficiency criteria used were the correlation coefficient, coefficient of determination, MAE, ME, RMSE, PBIAS, and COD.
3.1.2. Correlation of Rainfall
Figure 2 presents scatter plots comparing simulated rainfall from five CMIP6 climate models with observed rainfall data. The strength of the relationship is illustrated through linear regression lines, correlation coefficients (R), and regression equations. Overall, while all models showed statistically significant relationships with observed data (p < 2.2e-16), BCC-CSM2-MR, MRI-ESM2-0, and GFDL-ESM4 demonstrated stronger predictive skill for rainfall in the study area. In contrast, MIROC6 and CNRM-CM6-1 may require bias correction to improve their simulation accuracy.
Table 2 presents the performance of five climate models based on several statistical evaluation metrics before any bias correction is applied. These metrics include Mean Absolute Error (MAE), Mean Error (ME), Root Mean Square Error (RMSE), Pearson’s correlation coefficient (r), coefficient of determination (R²), percent bias (Pbias%), and an overall rank based on performance. The results highlight that no single model excels across all metrics. MRI-ESM2-0 shows the best overall statistical performance due to its strong correlation and explained variance, despite having relatively higher errors. GFDL-ESM4 and BCC-CSM2-MR also perform well, with lower error metrics and strong correlation. On the other hand, CNRM-CM6-1 underperforms significantly, with both lower correlation and higher bias, making it the least reliable model in this pre-correction evaluation.
Table 2. Pre-Bias Correction Performance Metrics for Climate Models.
Model | MAE | ME | RSME | r | R2 | Pbias% | Rank |
BCC-CSM2-MR | 61.64 | 46.47 | 85.06 | 0.85 | 0.73 | 47.40 | 2 |
GFDL-ESM4 | 52.33 | 29.84 | 78.15 | 0.83 | 0.70 | 30.40 | 3 |
MRI-ESM2-0 | 82.06 | 67.96 | 111.46 | 0.86 | 0.75 | 69.20 | 1 |
MIROC6 | 179.68 | 175.91 | 219.95 | 0.81 | 0.65 | 30.40 | 4 |
CNRM-CM6-1 | 56.36 | -28.73 | 80.48 | 0.62 | 0.39 | -29.30 | 5 |
3.1.3. Metrics Results Before Bias Correction
As seen in
Figure 2 above the model's findings of correlation analysis were used to determine which of the CMIP6 models performed best at the historical climate conditions in this study area among five models as well as
table 2 also showed the metrics result clearly. Therefore, the best models for climate projections in this study were GFDL-ESM4, MRI-ESM2-0, and BCC-CSM2-MR because of their great agreement with observed data, according to the correlation analysis. Future scenarios (2030-2059) and 2060-2089 evaluated rainfall trends in West Shewa using these three models for two SSP245 and SSP585 scenarios period.
Among the evaluated GCMs, three models BCC-CSM2-MR, MRI-ESM2-0, and GFDL-ESM4 exhibited a strong and statistically significant correlation (P < 0.05) with observed daily rainfall data prior to bias correction. Evaluation of CMIP6 model outputs against observational datasets indicated that BCC-CSM2-MR demonstrated particularly strong agreement with precipitation during the baseline period
| [36] | Y. W. Liu et al., “Evaluation of multidimensional simulations of summer air temperature in China from CMIP5 to CMIP6 by the BCC models: From trends to modes,” Adv. Clim. Chang. Res., vol. 13, no. 1, pp. 28-41, 2022, https://doi.org/10.1016/j.accre.2021.12.001 |
| [37] | J. Guo, X. Wang, C. Xiao, L. Liu, T. Wang, and C. Shen, “Evaluation of the temperature downscaling performance of PRECIS to the BCC-CSM2-MR model over China,” Clim. Dyn., vol. 59, no. 3, pp. 1143-1159, 2022, https://doi.org/10.1007/s00382-022-06177-5 |
[36, 37]
. Based on the performance metrics and consistency with observed data, these three GCMs were selected for bias correction and used in projecting future rainfall patterns.
3.1.4. Bias Correction
As presented in
Table 3, all three-climate models' rainfall simulation accuracy was greatly increased by the bias correction procedure. The Mean Absolute Error (MAE), Mean Error (ME), Root Mean Square Error (RMSE), and Percent Bias (Pbias%) all shown significant post-correction decreases, suggesting a decrease in both systematic and overall errors. In the MRI-ESM2-0 model, for example, the RMSE decreased from 111.46 to 52.62 and the MAE decreased from 82.06 to 39.35, indicating a significant improvement. It is also suggested that bias correction successfully reduced systematic overestimations or underestimations of rainfall, as evidenced by the nearly zero ME and Pbias% values following correction across all models. While the severity of errors dropped, the temporal correlation between observed and modeled rainfall remained robust and consistent, as evidenced by the interestingly unchanged or slightly improved correlation coefficient (r).
Table 3. Statistical Metrics results of rainfall before and after bias corrections for all models.
Model | MAE (BBC) | MAE (ABC) | ME (BBC) | ME (ABC) | RMSE (BBC) | RMSE (ABC) | Pbias% (BBC) | Pbias% (ABC) | r (BBC) | r (ABC) |
BCC-CSM2-MR | 61.64 | 40.02 | 46.47 | 0.05 | 85.06 | 54.69 | 47.4 | 0.1 | 0.85 | 0.84 |
GFDL-ESM4 | 52.33 | 38.73 | 29.84 | 0.34 | 78.15 | 53.99 | 30.4 | 0.3 | 0.83 | 0.85 |
MRI-ESM2-0 | 82.06 | 39.35 | 67.96 | -2.97 | 111.46 | 52.62 | 69.2 | -3 | 0.86 | 0.85 |
BBC = Before Bias Corrections, ABC = After Bias Corrections
3.2. Projected Rainfall Trends
Projected changes in mean rainfall for 2030 and 2060 under two Shared Socioeconomic Pathways (SSP245 and SSP585) are shown in
Table 4. According to the ensemble models, mean rainfall is expected to rise steadily throughout all time periods and scenarios, with somewhat larger increases under the more extreme emissions scenario (SSP585). In particular, SSP245 projects a small higher trend in rainfall, increasing it by 1.1% by 2030 and by 1.15% by 2060. The anticipated increases under SSP585 were marginally higher, at 1.2% by 2030 and 1.4% by 2060. These findings point to a progressive increase in rainfall, especially when emissions are higher, which may have consequences for planning for climate adaption and managing water resources in the ensuing decades.
Projections for North-East Africa show a clear north-south split in rainfall patterns. In the northern areas, rainfall is expected to decrease, while the southern parts are likely to see an increase, especially during the JJAS (June to September) and OND (October to December) seasons. This shift is mainly driven by global warming and changes in atmospheric circulation, which are altering how and where rain falls across the region. Increasing Rainfall in the South projections show that southern regions, especially Ethiopia and western Kenya, will have increases of 6.7% during JJAS and 4.5% during OND
| [38] | S. H. Gebrechorkos, S. Hülsmann, and C. Bernhofer, “Regional climate projections for impact assessment studies in East Africa,” Environ. Res. Lett., vol. 14, no. 4, 2019, https://doi.org/10.1088/1748-9326/ab055a |
| [39] | Y. W. Choi, D. J. Campbell, and E. A. B. Eltahir, “Near-term regional climate change in East Africa,” Clim. Dyn., vol. 61, no. 1-2, pp. 961-978, 2023, https://doi.org/10.1007/s00382-022-06591-9 |
| [40] | C. M. Wainwright, J. H. Marsham, D. P. Rowell, D. L. Finney, and E. Black, “Future changes in seasonality in east africa from regional simulations with explicit and parameterized convection,” J. Clim., vol. 34, no. 4, pp. 1367-1385, 2021, https://doi.org/10.1175/JCLI-D-20-0450.1 |
[38-40]
.
Planning for climate resilience is urgently needed since the anticipated changes in rainfall patterns could make East Africa's already existing vulnerabilities worse by impacting infrastructure, agriculture, and health
| [41] | G. Gebremeskel Haile, Q. Tang, S. Sun, Z. Huang, X. Zhang, and X. Liu, “Droughts in East Africa: Causes, impacts and resilience,” Earth-Science Rev., vol. 193, pp. 146-161, 2019, https://doi.org/10.1016/j.earscirev.2019.04.015 |
| [42] | A. H. Kassa, “Current climate change impacts and risks reviewed in Africa by giving especial emphasis in Ethiopia: Short review,” Int. J. Multidiscip. Res. Growth Eval., pp. 326-332, 2022, https://doi.org/10.54660/anfo.2022.3.6.14 |
[41, 42]
.
The complexity and variety of climatic impacts throughout the region are highlighted by certain studies, which suggest possible drops in rainfall in particular regions, such as the western Democratic Republic of the Congo
| [43] | K. Tshiabukole, P. Khonde, M. Muku, K. Vumilia, K. Lunekua, and M. Kankolongo, “Influence of Climate Variability on Seasonal Rainfall Patterns in South-Western DR Congo,” OALib, vol. 03, no. 09, pp. 1-9, 2016, https://doi.org/10.4236/oalib.1102952 |
| [44] | F. Bangelesa et al., “Projected changes in rainfall amount and distribution in the Democratic Republic of Congo - Evidence from an ensemble of high-resolution climate simulations,” Weather Clim. Extrem., vol. 42, no. June, p. 100620, 2023, https://doi.org/10.1016/j.wace.2023.100620 |
[43, 44]
.
Table 4. Changes in mean rainfall simulated in percent.
Model | SSP245_2030 | SSP245_2060 | SSP585_2030 | SSP585_2060 |
Ensemble simulated | 1.1% | 1.15% | 1.2% | 1.4% |
The statistical findings shown in
Table 5 based on the Mann-Kendall (MK) trend test offer important insights into expected shifts in rainfall patterns in the study area during the summer (Kiremt), spring (Belg), and dry season (Bega), as well as on a yearly basis. These projections were analyzed for two period of time in the future (2030-2059 and 2060-2089) under the two Shared Socioeconomic Pathways, SSP245 (moderate emissions) and SSP585 (high emissions). The MK Z-values indicate the strength and direction of rainfall trends, the p-values assess their statistical significance, and Sen's slope displays the projected rate of change over time.
For the near future period of 2030-2059, the data suggest that the Kiremt season may experience a significant increase in rainfall under SSP245, as indicated by a Z-value of 2.7 and a p-value of 0.01, which is below the conventional threshold for statistical significance. The Sen’s slope value of 5.25 further confirms that this increase was not only statistically significant but also substantial in magnitude. Under the more aggressive emission scenario (SSP585), although the Z-value is 1.9 with a p-value of 0.06, the trend was not statistically significant but still suggests a moderate increasing tendency in rainfall during Kiremt. This implies that under moderate climate change scenarios, the primary rainy season is expected to become wetter in the coming decades, which could benefit agricultural production if managed appropriately.
For the 2030-2059 timeframes, however, the Belg season exhibited no clear trends under either scenario. There is no noticeable trend in rainfall this spring, as indicated by the high p-values (0.89 for SSP245 and 0.78 for SSP585) and both Z-values near zero. This suggests that the variability in Belg rainfall may continue without a clear pattern of increase or decrease, presenting a challenge for sectors dependent on this secondary rainy season, such as short-cycle cropping and rain-fed farming systems that rely on timely and sufficient rainfall during this period. Kiremt Rainfall Trends indicate increasing or variable trends in Kiremt rainfall in Ethiopia under RCP scenarios (comparable to SSPs) with regional differences; the study show increasing trends in some regions and decreasing in others, emphasizing spatial heterogeneity
| [45] | T. M. Weldegerima, T. T. Zeleke, B. S. Birhanu, B. F. Zaitchik, and Z. A. Fetene, “Analysis of Rainfall Trends and Its Relationship with SST Signals in the Lake Tana Basin, Ethiopia,” Adv. Meteorol., vol. 2018, 2018, https://doi.org/10.1155/2018/5869010 |
[45]
. These findings align with these studies, showing a near-term increase that becomes ambiguous later.
Belg season rainfall has historically shown high variability and weak trends, as shown by
| [46] | Z. T. Segele and P. J. Lamb, “Characterization and variability of Kiremt rainy season over Ethiopia,” Meteorol. Atmos. Phys., vol. 89, no. 1, pp. 153-180, 2005, https://doi.org/10.1007/s00703-005-0127-x |
| [47] | G. G. Haile et al., “Projected Impacts of Climate Change on Drought Patterns Over East Africa,” Earth’s Futur., vol. 8, no. 7, pp. 1-23, 2020, https://doi.org/10.1029/2020EF001502 |
| [48] | G. Bayable, G. Amare, G. Alemu, and T. Gashaw, “Spatiotemporal variability and trends of rainfall and its association with Pacific Ocean Sea surface temperature in West Harerge Zone, Eastern Ethiopia,” Environ. Syst. Res., vol. 10, no. 1, 2021, https://doi.org/10.1186/s40068-020-00216-y |
[46-48]
. These studies found that Belg is sensitive to ENSO and local circulation patterns, making long-term trends harder to detect. non-significant trends for Belg support these findings, indicating the continued unpredictability of this season under climate change.
Bega season generally contributes less rainfall, but increasing trends have been identified in some parts of Ethiopia, possibly due to warming-induced changes in rainfall patterns.
| [49] | H. T. Kahsay, D. D. Guta, B. S. Birhanu, T. G. Gidey, and J. K. Routray, “Farmers’ Perceptions of Climate Change Trends and Adaptation Strategies in Semiarid Highlands of Eastern Tigray, Northern Ethiopia,” Adv. Meteorol., vol. 2019, 2019, https://doi.org/10.1155/2019/3849210 |
[49]
. This result confirm significant Bega rainfall increases in the near future, consistent with recent projections.
suggests that East Africa is likely to experience increased annual precipitation; particularly under high-emission scenarios (SSP585).
| [51] | C. Funk et al., “The climate hazards infrared precipitation with stations - A new environmental record for monitoring extremes,” Sci. Data, vol. 2, pp. 1-21, 2015, https://doi.org/10.1038/sdata.2015.66 |
[51]
discussed an inconsistency of increased rainfall but greater variability, especially in highland areas. Significant rainfall increases are expected during the Bega and Kiremt seasons and annually in the near term (2030-2059). Long-term projections (2060-2089) show less certainty, with trends becoming statistically insignificant. Belg rainfall remains highly variable with no significant trends detected. These findings align with regional climate model projections and are supported by studies such as
| [45] | T. M. Weldegerima, T. T. Zeleke, B. S. Birhanu, B. F. Zaitchik, and Z. A. Fetene, “Analysis of Rainfall Trends and Its Relationship with SST Signals in the Lake Tana Basin, Ethiopia,” Adv. Meteorol., vol. 2018, 2018, https://doi.org/10.1155/2018/5869010 |
| [50] | T. Zhou, “New physical science behind climate change: What does IPCC AR6 tell us?,” Innovation, vol. 2, no. 4, p. 100173, 2021, https://doi.org/10.1016/j.xinn.2021.100173 |
| [52] | G. Feyissa, G. Zeleke, W. Bewket, and E. Gebremariam, “Downscaling of future temperature and precipitation extremes in Addis Ababa under climate change,” Climate, vol. 6, no. 3, 2018, https://doi.org/10.3390/cli6030058 |
[45, 50, 52]
.
Table 5. Mann-Kendall trend test results for projected seasonal and annual mean rainfall under SSP245 and SSP585 scenarios for the periods 2030-2059 and 2060-2089.
Ensemble Model | Period 2030-2059 | Period 2060-2089 |
SSP245 | SSP585 | SSP245 | SSP585 |
Rainfall MK results | Z | p-value | Sen's slope | Z | p-value | Sen's slope | Z | p-value | Sen's slope | Z | p-value | Sen's slope |
Kiremt | 2.7 | 0.01* | 5.25 | 1.9 | 0.06 | 5.18 | 1.1 | 0.25 | 2.74 | 0.4 | 0.69 | 0.94 |
Belg | -0.1 | 0.89 | -0.34 | 0.3 | 0.78 | 0.30 | 1.3 | 0.17 | 2.16 | 1.4 | 0.16 | 1.19 |
Bega | 2.7 | 0.01* | 1.50 | 2.4 | 0.02* | 2.03 | 0.5 | 0.62 | 0.39 | 0.0 | 0.97 | -0.03 |
Annual | 2.4 | 0.02* | 5.86 | 2.4 | 0.03* | 8.67 | 1.6 | 0.11 | 4.98 | 1.0 | 0.31 | 2.70 |
The results revealed that for the 2030-2059 decades, however, the Bega season showed statistically significant growing trends under both SSP245 and SSP585. The related p-values were 0.01 and 0.02, and the MK Z-values were 2.7 and 2.4, respectively. These numbers suggest that even the normally dry (Bega) season might soon get wetter. Even while this change was not as significant as it was during Kiremt, the Sen's slope values of 1.50 and 2.03 further imply that it may have an impact on dry season agriculture, water availability, and hydrological planning, particularly in regions that are already under water stress during this season. As many crops in the study area grow and reach the harvesting stage during the Bega season, it could result in crop losses.
It was observed that under both climatic scenarios, annual rainfall totals for the years 2030-2059 likewise demonstrated notable upward trends. It is predicted that the total annual rainfall will increase, with Z-values of 2.4 and p-values slightly above 0.02 and 0.03 respectively. Sen's slope values of 5.86 under SSP245 and 8.67 under SSP585 supported this, showing that annual rainfall is expected to rise overall, with a greater increase under the higher emissions scenario. According to these findings, the research area could experience an increase in rainfall in the near future, which might lessen the frequency of droughts but also increase the risk of flooding and problems with water management.
The findings indicated that as we move further into the late-century period of 2060-2089, we tend to see a decline in the significance and intensity of rainfall trends throughout the course of most seasons. Kiremt's MK Z-values decrease to 1.1 (SSP245) and 0.4 (SSP585) with matching p-values of 0.25 and 0.69, indicating that the previously observed increasing trend is no longer statistically significant. This suggests that throughout the second half of the century, summer rainfall patterns might either stabilize or grow more erratic. Similarly, there are no statistically significant changes during the Belg season, even though there have been slight improvements in both situations. There is some upward movement in rainfall, as indicated by Z-values of 1.3 and 1.4 and p-values of 0.17 and 0.16, but not enough to support a strong trend.
The results showed that in the later observation period, the increasing patterns of rainfall observed earlier diminished for the Bega season. The MK test showed Z-values near zero with p-values of 0.62 and 0.97 under SSP245 and SSP585, respectively, and insignificant Sen's slope values. This suggests a return to consistent or slightly declining precipitation throughout the dry season, which might further stress water resources and dry season livelihoods if left unmanaged. For the 2060-2089 periods, both scenarios showed a consistent increase in yearly rainfall, despite the fact that the p-values were not statistically significant. Though this is unclear, the trend is still more pronounced under SSP245 (Z=1.6, Sen's slope=4.98), indicating that wetter conditions might persist.
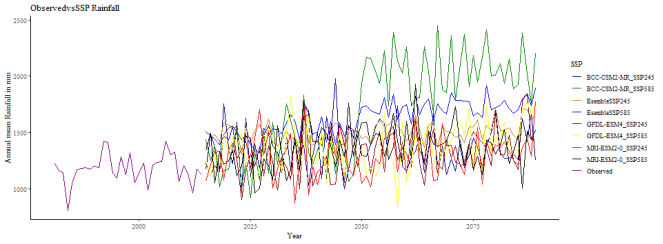
Figure 3. Time Series of Annual Mean Rainfall.
Furthermore,
Figure 3 displays the annual mean rainfall time series during the observation periods, highlighting both interannual variability and long-term trends. The graph's observable annual changes in rainfall suggest a significant degree of climate variability. The alternating drier years and seasons of somewhat greater rainfall demonstrate the region's susceptibility to both wet and dry extremes. Notwithstanding this variability, the annual mean rainfall has a general upward trend, particularly in the middle to late 21st century, suggesting a potential long-term increase in total rainfall. This is in line with estimations from climate models that forecast wetter conditions under future climatic scenarios. The increasing trend, if sustained, could have significant implications for water availability and agricultural productivity, although it also raises concerns about potential flooding and the need for effective water management strategies.
Under SSP585 BCC-CSM2-MR (Green and Blue Lines), this model shows a significant upward trend, projecting sharp increases in annual rainfall toward the end of the century. Its SSP245 projection is also higher than historical values but more moderate. MRI-ESM2-0 (Red and Black Lines), this model projects relatively consistent values with observed data under SSP245 but shows increased variability under SSP585. GFDL-ESM4 (Orange and Yellow Lines), this model's projections under both scenarios are more stable and remain closer to the observed historical range, suggesting a more conservative outlook on future rainfall changes. Overall, the
figure 3 illustrates that climate models project a general increase in future rainfall under higher emission scenarios, particularly evident in the BCC-CSM2-MR and MRI-ESM2-0 outputs. The variability is more pronounced under SSP585, reflecting greater uncertainty and potential climate extremes under unchecked greenhouse gas emissions. Meanwhile, ensemble means serve as useful central estimates, though individual models show substantial spread highlighting the importance of multi-model approaches in climate impact assessments.
3.3. Future Rainfall Projections Under SSP Scenarios in Different Climate Models
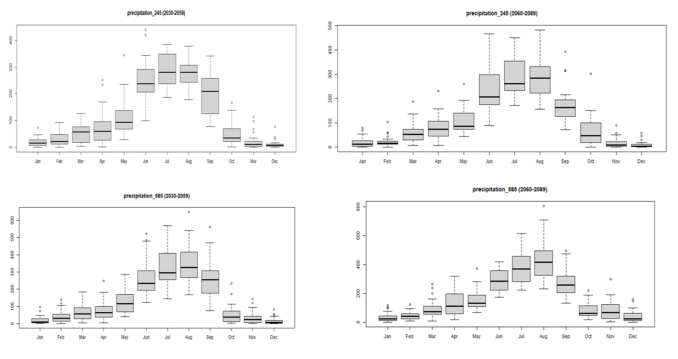
Based on the BCC-CSM2-MR climate model,
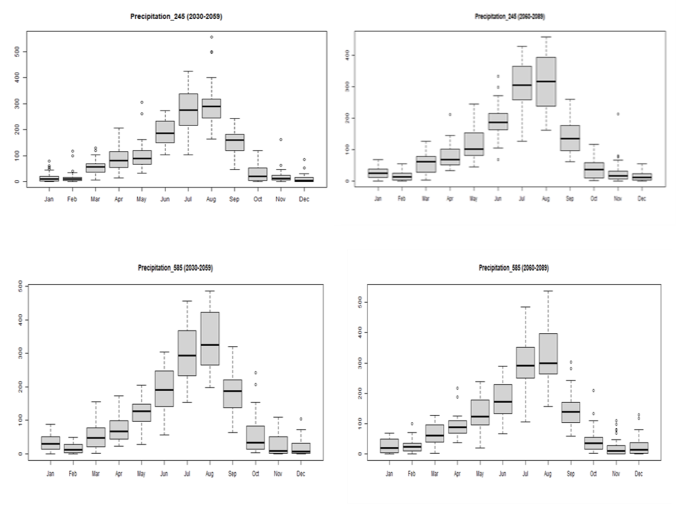
Figure 4 shows the seasonal distribution and anticipated variations in monthly rainfall under the SSP245 and SSP585 future scenarios. A distinct wet season pattern was highlighted by the model, which represented the predominant rainfall peak throughout the Kiremt season (June to September). The maximum monthly rainfall during Kiremt is predicted by SSP245 to be 400mm in 2030 and 450mm by 2060, suggesting a progressive intensification of seasonal precipitation. On the other hand, for both decades, the model predicts little to no rainfall (0mm) during the dry months of January through April and October through December.
Figure 4. Projected Monthly Mean Rainfall Patterns and Variability under SSP Scenarios in the BCC-CSM2-MR Model.
According to projections, January, February, March, April, May, September, October, November, and December in 2060 and January, April, May, June, October, November, and December in 2030 are outlier months with abnormally high rainfall. Rainfall during the Kiremt season increases in the high-emission scenario SSP585, with maximum monthly values of 550mm in 2030 and 700mm in 2060. Nevertheless, for the same dry months over both times, the minimal rainfall stays at 0mm. significantly, erratic and unusual patterns of rainfall emerge throughout normally dry months, indicating increased unpredictability in rainfall. These anomalies include January, February, April, June, August, September, October, November, and December for 2030 and January, February, March, May, August, September, October, November, and December for 2060. Overall, the graph highlights the seasonal regularity as well as the future unpredictability in rainfall patterns, highlighting the possibility of more intense wet spells and larger inter-monthly variations under future climate scenarios.
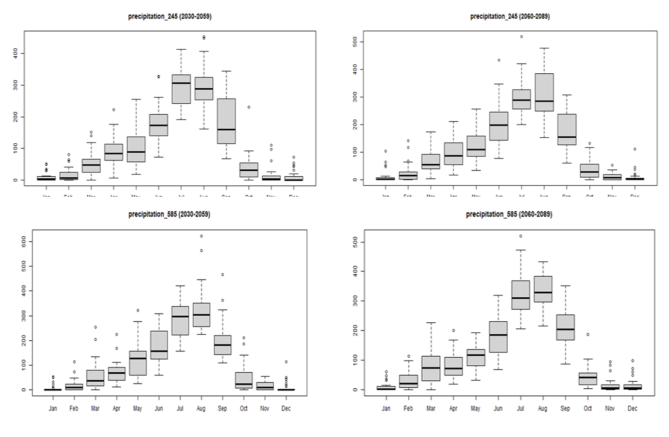
Furthermore, the monthly mean rainfall as simulated by the GFDL-ESM4 climate model is shown in
figure 5, which provides information on seasonal rainfall patterns and variability under the SSP245 and SSP585 future climate scenarios. A noticeable rainfall peak during the Kiremt rainy season (June to September) is depicted in the figure. Expectations of a wetter rainy season are reinforced by the model's projection of a monthly maximum rainfall of 400mm in 2030 and 450mm in 2060 under SSP245. For both decades, the driest months, such as January through April and October through December, were consistently associated with the lowest rainfall (0mm). However, it is anticipated that off-season months would see rainfall anomalies such as unusually high or varying monthly rainfall. Specifically, the year 2030 shows irregularities in January, February, March, April, June, August, October, November, and December, while 2060 exhibits similar anomalies in January, February, June, July, October, November, and December.
The results also showed that there is no significant rise in Kiremt rainfall over time, reaching 450mm in 2030 and 2060 under the high-emissions scenario SSP585. Once more, for the normal dry months, the minimum rainfall is 0mm. However, the model shows significant variability, with a wider range of irregularities in January, February, March, April, May, August, September, October, and December for 2060 and anomalously high rainfall events in January, February, April, July, October, November, and December for 2030. These variations suggest possible changes in the timing and distribution of rainfall, which may have a substantial effect on water resource management and agricultural cycles. Overall,
Figure 5 highlights both the persistence of seasonal rainfall peaks and the growing unpredictability of rainfall patterns under climate change, emphasizing the importance of adaptive planning in climate-sensitive regions.
Figure 5. Projected monthly Mean Rainfall Patterns and Variability under SSP Scenarios in the GFDL-ESM4 Model.
The MRI-ESM2-0 model's predicted monthly mean rainfall patterns and variability under the SSP245 and SSP585 scenarios are depicted in
Figure 6, which also shows the increased frequency of anomalous rainfall occurrences and the temporal shifts in precipitation. Peaks in rainfall are noticeable during the Kiremt rain season (June to September), with monthly maximum values under SSP245 rising to 420mm in 2030 and 480mm by 2060. Under SSP585, the peaks are even more noticeable, rising to 480mm in 2030 and 580mm in 2060. According to these forecasts, the main rainy season will continue to intensify, especially in scenarios with larger emissions. However, particularly during normal dry months, the MRI-ESM2-0 model also predicts significant rainfall anomalies. Outlier rainfall occurrences were noted under SSP245 in April, June, November, and December of 2060 and January, February, March, May, August, November, and December of 2030. Similarly, the model under SSP585 shows anomalies in October and December for 2030, as well as an expanded set that includes February, April, September, October, November, and December for 2060. Rising climate variability is shown by the increase in the frequency and distribution of these erratic rainfall episodes over non-Kiremt months. These points to an increasing probability of unpredictable rainy episodes outside of the typical rainy season, which could present challenges for planning for climate adaption, agriculture, and water resource management.
Projected Seasonal and Monthly Rainfall Variability under Future Climate Scenarios
Based on simulations from the BCC-CSM2-MR, GFDL-ESM4, and MRI-ESM2-0 climate models, the study analyzed projected seasonal and monthly rainfall trends under SSP245 and SSP585 scenarios for the mid-21st century (2030 and 2060). All three models consistently indicate a evident seasonal rainfall peak during the Kiremt season (June-September), affirming the persistence of Ethiopia’s traditional rainy season. However, each model also reveals sharp variability and anomalous rainfall events outside this typical season, suggesting a shift toward more unpredictable rainfall regimes. The BCC-CSM2-MR model projects a steady increase in Kiremt rainfall, with monthly maxima rising from 400mm in 2030 to 450mm in 2060 under SSP245, and from 550mm to 700mm under SSP585, indicating a strong intensification of wet-season precipitation in a warming climate. Similarly, the MRI-ESM2-0 model reflects a comparable rise, projecting monthly peaks of 420mm to 480mm (SSP245) and 480mm to 580mm (SSP585) between 2030 and 2060.
Figure 6. Projected monthly Mean Rainfall Patterns and Variability under SSP Scenarios in the MRI-ESM-0 Model.
In contrast, the GFDL-ESM4 model maintains constant maximum Kiremt rainfall (450mm) under SSP585 across both decades, implying no significant increase over time, but reinforcing the existing seasonal rainfall concentration. These results align with findings from
| [50] | T. Zhou, “New physical science behind climate change: What does IPCC AR6 tell us?,” Innovation, vol. 2, no. 4, p. 100173, 2021, https://doi.org/10.1016/j.xinn.2021.100173 |
| [51] | C. Funk et al., “The climate hazards infrared precipitation with stations - A new environmental record for monitoring extremes,” Sci. Data, vol. 2, pp. 1-21, 2015, https://doi.org/10.1038/sdata.2015.66 |
[50, 51]
, which suggest that East Africa, including Ethiopia, is likely to experience an increase in seasonal rainfall under higher emissions scenarios, though the degree of intensification remains uncertain and model-dependent.
| [38] | S. H. Gebrechorkos, S. Hülsmann, and C. Bernhofer, “Regional climate projections for impact assessment studies in East Africa,” Environ. Res. Lett., vol. 14, no. 4, 2019, https://doi.org/10.1088/1748-9326/ab055a |
[38]
also observed a potential increase in Kiremt rainfall under RCP8.5 scenarios, particularly in the central and western highlands.
All three models, minimal rainfall is projected for the traditionally dry months (January to April and October to December), with 0mm consistently simulated. However, anomalies were noted in these dry periods, especially under SSP585. The BCC-CSM2-MR model, for instance, indicates unusually high rainfall in January, February, April, and December, suggesting possible off-season wet spells.
| [46] | Z. T. Segele and P. J. Lamb, “Characterization and variability of Kiremt rainy season over Ethiopia,” Meteorol. Atmos. Phys., vol. 89, no. 1, pp. 153-180, 2005, https://doi.org/10.1007/s00703-005-0127-x |
| [47] | G. G. Haile et al., “Projected Impacts of Climate Change on Drought Patterns Over East Africa,” Earth’s Futur., vol. 8, no. 7, pp. 1-23, 2020, https://doi.org/10.1029/2020EF001502 |
[46, 47]
observed similar patterns in MRI-ESM2-0, where December and November repeatedly appear as anomalously wet months under both scenarios. These off-season rainfall events may be linked to changing regional circulation patterns, increased sea surface temperatures, and interactions with ENSO phases, as suggested. They underscore the growing unpredictability in East Africa’s rainfall regime, which could have significant implications for agriculture, water resource planning, and disaster risk reduction. While all models agree on the seasonality of rainfall, their responses to different emissions scenarios vary; BCC-CSM2-MR and MRI-ESM2-0 show clear sensitivity to emission intensity, with SSP585 producing significantly higher rainfall peaks than SSP245; GFDL-ESM4, on the other hand, projects limited growth in rainfall even under high-emissions scenarios, but with marked increases in rainfall irregularities during the dry months. This inter-model variability reflects a broader uncertainty highlighted in literature, for example,
| [53] | C. M. Dunning, “Characterising and Understanding Trends and Variability in African Rainfall Seasonality,” no. May, p. 198, 2018. |
[53]
emphasized the difficulty climate models have inconsistently simulating African monsoon systems, leading to divergent outcomes across different General Circulation Models (GCMs). Therefore, while the direction of change (i.e., more intense wet seasons and erratic dry seasons) is relatively consistent, the magnitude and exact timing remain uncertain, reinforcing the need for ensemble approaches and downscaling for localized decision-making.
Overall, projections from the BCC-CSM2-MR, GFDL-ESM4, and MRI-ESM2-0 models under SSP245 and SSP585 reveal two critical understandings that are the intensification of the main rainy season (Kiremt), especially under high emissions pathways, suggesting potential for more productive agricultural windows but also greater flood risks. Increased rainfall anomalies during typically dry months, signaling potential disruptions to traditional farming calendars and water management strategies.
These findings are broadly consistent with those of
| [38] | S. H. Gebrechorkos, S. Hülsmann, and C. Bernhofer, “Regional climate projections for impact assessment studies in East Africa,” Environ. Res. Lett., vol. 14, no. 4, 2019, https://doi.org/10.1088/1748-9326/ab055a |
| [52] | G. Feyissa, G. Zeleke, W. Bewket, and E. Gebremariam, “Downscaling of future temperature and precipitation extremes in Addis Ababa under climate change,” Climate, vol. 6, no. 3, 2018, https://doi.org/10.3390/cli6030058 |
| [54] | B. Nile, G. G. Chakilu, and S. Szegedi, “The Dynamics of Hydrological Extremes under the Highest Emission Climate Change Scenario in the Headwater,” 2023. |
[38, 52, 54]
, all of which attention that future climate change is likely to increase hydrological extremes and intra-seasonal variability in Ethiopia. As such, adaptive planning, improved early warning systems, and flexible water resource management will be essential to buffer against both droughts and anomalous rainfall events in a changing climate.
3.4. Standard Precipitation Index (SPI)
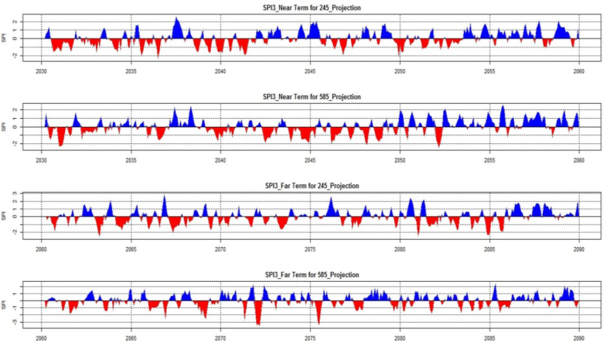
Analyzing SPI3 data for the 2030-2059 and 2060-2089 periods in
Figure 7 shows notable variations in precipitation, emphasizing both dry and wet anomalies. The SSP245 scenario, which represents a stabilization pathway with considerable mitigation, shows a somewhat balanced distribution of anomalies for the 2030-2059 timeframes, but still has a noticeable incline toward dryness. Of the years, about 30-35% are dry (SPI < -1.0), 20-25% are wet, and the remaining years are in the near-normal range. This dry trend is more noticeable over the 2060-2089 timeframe, with 35-40% of years having dry conditions and a modest rise in wet anomalies to roughly 25-30%. The frequency of near-normal years correspondingly decreases. This scenario suggests a moderate but growing risk of hydro climatic extremes over time, posing threats to stable water availability and crop productivity.
The trend toward extremes is expected to be far more pronounced under the SSP585 scenario, which is predicated on high emissions and no mitigation activity. Thirty-five to forty percent of the years between 2030 and 2059 are expected to be dry, and more years are getting close to the severe drought thresholds. About 20-25% of anomalies are still wet, though occasionally they are more intense. The situation worsens between 2060 and 2089, with certain years exhibiting extreme dryness (SPI < -2.0) and additional dry years rising to roughly 45%. The percentage rises to about 30% in wet years as well, but there are again rapid peaks, indicating more rainfall in shorter periods. A large decline in the percentage of near-normal years suggests a move away from reliable seasonal patterns and toward climatic unpredictability.
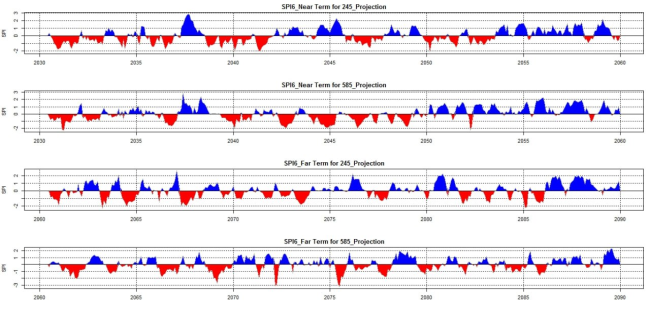
The frequency of moderate and severe dry and wet years is shown in
Figure 8, which displays the SPI6 values for the 2030-2059 and 2060-2085 periods under the SSP245 and SSP585 scenarios. According to SSP245, moderate and severe dry years make up roughly 33% of the 2030-2059 periods, while wet years make up roughly 35%. This indicates a near-balance with a small trend towards wetter conditions. Dry years rise to 44% and wet years fall to 31% under SSP585 during the same time period, indicating increasing drought. With 35% dry years and 33% wet years, SSP245 has very steady conditions for the 2060-2085 timeframe.
A notable change toward drier conditions is indicated by the substantial decline in wet years to 22% and the increase in dry years to 54% under SSP585 Prolonged and more frequent droughts could threaten agricultural productivity, water resources, and food security, indicating the need for robust climate adaptation strategies, such as drought-resistant crops, effective irrigation systems, and long-term water planning to protect the well-being and resilience of impacted communities.
Figure 7. Standardized Precipitation Index over a 3-month timescale (SPI3) for the periods 2030-2059 and 2060-2085 under SSP245 and SSP585 climate scenarios.
Figure 8. Standardized Precipitation Index over a 6-month timescale (SPI6) for the periods 2030-2059 and 2060-2085 under SSP245 and SSP585 climate scenarios.
The
figure 7 presents the 3-month Standardized Precipitation Index (SPI3) projections under two climate scenarios SSP245 (moderate emissions) and SSP585 (high emissions) across near-term (2030-2059) and far-term (2060-2089) periods. Visually, the blue bars represent wetter-than-normal conditions, while the red bars indicate drier periods or droughts. In the near term, both scenarios show a frequent alternation between wet and dry episodes, but SSP585 displays slightly more severe drought events, particularly after 2045. This trend intensifies in the far-term projections: under SSP585, SPI3 values exhibit more extreme negative anomalies (droughts below -2) and fewer prolonged wet spells compared to SSP245. This suggests a future where extreme droughts become more intense and frequent under high emissions, aligning with findings by Gebrechorkos et al. (2019), who observed increasing drought severity across East Africa under RCP8.5 scenarios. Similarly, IPCC AR6 (2021) concludes that high-emission scenarios will significantly amplify hydro climatic variability, heightening both flood and drought risks in the region. In contrast, the SSP245 scenario shows relatively stable SPI patterns in the far term, reflecting the potential mitigation benefits of reduced greenhouse gas emissions. This agrees with Segele and Lamb (2005), who emphasized that while East Africa has always experienced high rainfall variability, future extremes could be managed through moderate emissions trajectories. Overall, the SPI3 projections in the figure echo the scientific consensus that East Africa, including Ethiopia, faces a future of more intense hydro climatic extremes especially without strong climate action.
Table 6. SPI values and drought categories (WMO, 2012).
SPI values | Drought Classification |
>2 | Extreme wet |
1.5<SPI≤ 2 | Severe Wet |
1<SPI≤ 1.5 | Moderate Wet |
0.5<SPI≤ 1 | Slight Wet |
-0.5< SPI ≤ -0.5 | Slight Drought |
-1.5< SPI ≤ -1 | Moderate drought |
-2 < SPI ≤ 1.5 | Severe Drought |
<-2 | Extreme Drought |
The
Figure 8 shows the 6-month Standardized Precipitation Index (SPI6) projections under two Shared Socioeconomic Pathways (SSPs) SSP245 and SSP585 in near-term (2030-2059) and far-term (2060-2089) scenarios. These SPI6 plots are particularly useful for identifying medium-term droughts or wet spells that affect agriculture and water resources. In the near-term projections, both scenarios show alternating wet (blue) and dry (red) conditions, but the SSP585 scenario reveals a noticeable increase in the intensity and frequency of extreme wet events, especially from 2045 onwards. The far-term SSP585 projection exhibits even more dramatic wet and dry fluctuations, with prolonged drought events dropping below -2 SPI and wet periods reaching above 2, suggesting increased hydro climatic instability. In contrast, the SSP245 scenario continues more moderate variability with shorter drought durations and less noticeable wet spells.
These findings align with the conclusions of
| [55] | B. Lyon, “Seasonal drought in the Greater Horn of Africa and its recent increase during the March-May long rains,” J. Clim., vol. 27, no. 21, pp. 7953-7975, 2014, https://doi.org/10.1175/JCLI-D-13-00459.1 |
[55]
, who identified that East Africa is likely to experience sensitive rainfall variability under stronger radiative forcing scenarios. Furthermore, studies such as
| [56] | C. Funk et al., “Examining the role of unusually warm Indo-Pacific sea-surface temperatures in recent African droughts,” Q. J. R. Meteorol. Soc., vol. 144, no. June 2017, pp. 360-383, 2018, https://doi.org/10.1002/qj.3266 |
[56]
attention that despite possible wetter conditions in some years, drought risk remains critical due to rising temperatures that amplify evapotranspiration. In the far term, the high-emission SSP585 scenario repeats the patterns observed by
| [32] | F. M. Rettie, S. Gayler, T. K. D. Weber, K. Tesfaye, and T. Streck, “Comprehensive assessment of climate extremes in high-resolution CMIP6 projections for Ethiopia,” Front. Environ. Sci., vol. 11, no. May, pp. 1-18, 2023, https://doi.org/10.3389/fenvs.2023.1127265 |
[32]
, who projected that under continued high emissions, Ethiopia will encounter more frequent and prolonged droughts posing severe risks to food security and water availability. Overall, the SPI6 analysis provides clear evidence that long-term planning must account for not only increasing mean rainfall but also greater extremes in precipitation patterns. These projections reaffirm that moderate emissions (SSP245) could reduce the severity of climate impacts, supporting the urgency of climate mitigation efforts as stressed in the IPCC
.
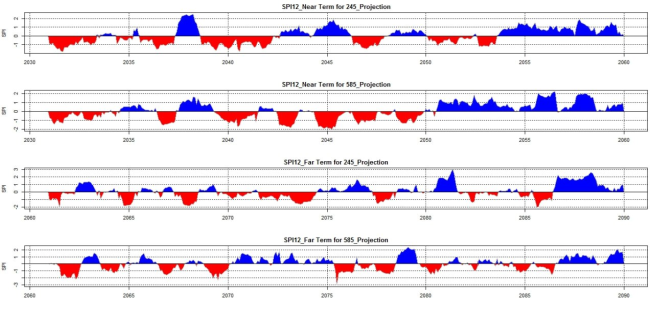
The 12-month Standardized Precipitation Index (SPI12), which depicts long-term precipitation trends for the 2030-2059 and 2060-2085 timeframes under SSP245 and SSP585 scenarios, is shown in
Figure 9. According to SSP245, moderate and severe dry years together make up about 29% of the 2030-2059 timeframe, whereas wet years make up about 36%. This suggests a possibly wetter long-term trend that is good for the stability of water resources. However, under SSP585, wet years fall to 28% and dry years rise to 39%, suggesting a move toward drier annual conditions. SSP245 indicates a balanced but fluctuating climate with 33% dry years and 32% wet years during the 2060-2085 timeframe. The frequency of dry years increases dramatically to 50% under SSP585, while the frequency of wet years drops to 20%, highlighting worsening drought conditions and lower yearly precipitation. Significant effects on livelihoods, particularly in the areas of agriculture, water supply, and ecosystem services, are expected by these changes, especially under SSP585.
Proactive adaptation measures including better water harvesting, climate-resilient farming techniques, and community-level drought preparedness plans are crucial since communities may experience increased water scarcity, crop failure risks, and decreased hydropower reliability.
Figure 9 presents the 12-month Standardized Precipitation Index (SPI12) projections under two emissions scenarios SSP245 (moderate) and SSP585 (high) in both near-term (2030-2059) and far-term (2060-2089) periods. SPI12 is a long-term drought indicator, capturing annual cumulative precipitation deficits or surpluses, and is especially relevant for monitoring hydrological droughts and long-term water availability. In the near term under SSP245, seen a relatively balanced distribution of wet (blue) and dry (red) periods. However, there are notable wet incidents around 2040 and after 2050, with SPI values exceeding +2, which suggests intense wet years. Dry periods remain frequent but moderate, not often dropping below -1.5 SPI. In contrast, the SSP585 near-term projection shows extended and more intense dry periods from the late 2030s through mid-2040s, followed by a shift to sustained wet conditions after 2050, indicating increasing precipitation variability. In the far term, both scenarios exhibit more extreme behavior. Under SSP2-4.5, there is a mix of moderate droughts and substantial wet periods, including a pronounced wet spell around 2080 (SPI > 2.5). However, the SSP585 far-term projection shows even stronger instability, with some drought episodes exceeding -2.5 SPI and wet periods nearing +2, reflecting a highly variable hydro climate. This increase in interannual variability is consistent with the expected outcomes of higher greenhouse gas forcing, as reported by the Intergovernmental Panel on Climate Change or IPCC
| [57] | J. Strandsbjerg Tristan Pedersen et al., “An assessment of the performance of scenarios against historical global emissions for IPCC reports,” Glob. Environ. Chang., vol. 66, p. 102199, 2021, https://doi.org/10.1016/j.gloenvcha.2020.102199 |
[57]
.
Figure 9. Standardized Precipitation Index over a 12-month timescale (SPI12) for the periods 2030-2059 and 2060-2085 under SSP245 and SSP585 climate scenarios.
These findings align with
| [58] | V. O. Otieno and R. O. Anyah, “CMIP5 simulated climate conditions of the Greater Horn of Africa (GHA). Part II: projected climate,” Clim. Dyn., vol. 41, no. 7, pp. 2099-2113, 2013, https://doi.org/10.1007/s00382-013-1694-z |
[58]
, who found that in East Africa, increased radiative forcing leads to more extreme rainfall patterns, which can manifest as both severe droughts and floods. Likewise,
| [59] | A. Alemayehu and W. Bewket, “Determinants of smallholder farmers’ choice of coping and adaptation strategies to climate change and variability in the central highlands of Ethiopia,” Environ. Dev., vol. 24, pp. 77-85, 2017, https://doi.org/10.1016/j.envdev.2017.06.006 |
[59]
documented how prolonged droughts interspersed with intense rainfall events are likely to intensify under high-emissions scenarios in Ethiopia, particularly affecting rainfed agriculture and water supply systems. Furthermore,
| [60] | C. Sanchez and D. Dunning, “Overconfidence among beginners: Is a little learning a dangerous thing?,” J. Pers. Soc. Psychol., vol. 114, no. 1, pp. 10-28, 2018, https://doi.org/10.1037/pspa0000102 |
[60]
emphasized that changes in seasonality and intra-annual rainfall variability, driven by warming oceans and altered circulation patterns, will likely increase under SSP585. Ultimately,
Figure 9 reinforces that long-term climate planning must address the increasing risks of hydrological extremes both in terms of drought resilience and flood preparedness. It also supports the case for emissions mitigation, as the SSP245 scenario presents less extreme and more manageable precipitation patterns compared to the high-impact SSP585 pathway.
General, the SPI3, SPI6, and SPI12 projections highlight a clear narrative: high-emission scenarios (SSP585) significantly intensify the frequency and intensity of hydro climatic extremes across all timescales in Ethiopia. These findings strongly reinforce existing literature and global climate assessments e.g., IPCC AR6, 2021
| [57] | J. Strandsbjerg Tristan Pedersen et al., “An assessment of the performance of scenarios against historical global emissions for IPCC reports,” Glob. Environ. Chang., vol. 66, p. 102199, 2021, https://doi.org/10.1016/j.gloenvcha.2020.102199 |
[57]
suggesting urgent climate mitigation is essential to buffer East Africa’s socio-economic systems against increasingly instable weather. Moderate emission scenarios (SSP245) offer a comparatively stable future, underscoring the benefits of emissions control in preserving water security and agricultural sustainability.