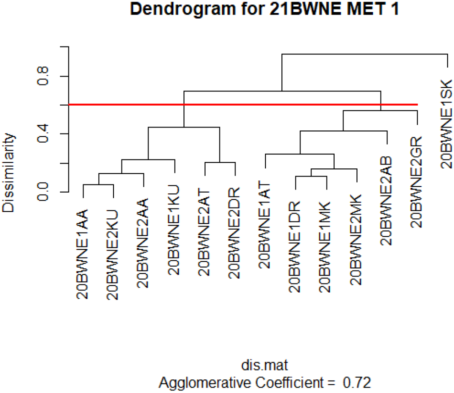
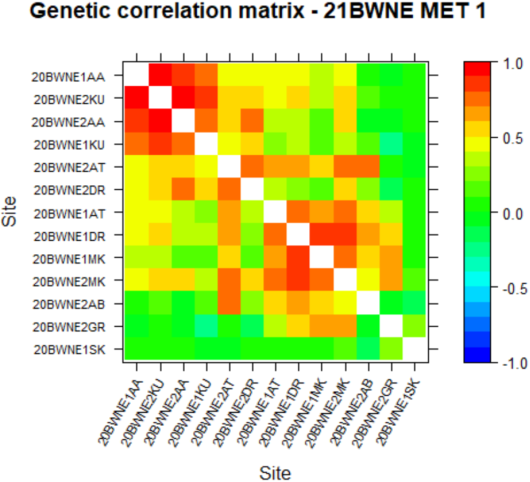
To predict bread wheat genetic potential across environments and adaption in low moisture stress wheat growing areas of Ethiopia. Multi-location trials were conducted in Ethiopia from 2020 to 2021 in main seasons. A total of advanced genotypes including the checks were arranged in randomized complete block design in a rectangular (row x column) array of plots with two replications. The results showed that, under the linear mixed model, the spatial and factor analytic models were efficient methods of data analysis for this study. By ranking average best linear unbiased prediction (BLUPs) within clusters, the 13 bread wheat environments were clustered into three mega environments (C1, C2, and C3) for the trait grain yield. This method used as a selection indicator, assisting in the selection of superior and adaptable types. The predicted performance of genotypes based on BLUP values averaged across correlated settings of C1 and C2, eliminating C3 due to low genetic correlation with the other trials and low genetic variation. Based on these clusters, the genotypes with the highest potential EBW192350 and EBW192369 were selected for a subsequent verification study that might potentially use them as a released variety. For genetic variance, the estimates for variance component parameters ranged from 0.069 to 2.896 and error variance, they ranged from 0.175 to 1.002. Therefore, increasing the application of this efficient analysis method will improve the selection of superior bread wheat varieties. The two genotypes can be further verified using national performance trials/ or verified in farmers’ fields for registration and commercialization.
| Published in | American Journal of Biological and Environmental Statistics (Volume 10, Issue 3) |
| DOI | 10.11648/j.ajbes.20241003.15 |
| Page(s) | 76-86 |
| Creative Commons |
This is an Open Access article, distributed under the terms of the Creative Commons Attribution 4.0 International License (http://creativecommons.org/licenses/by/4.0/), which permits unrestricted use, distribution and reproduction in any medium or format, provided the original work is properly cited. |
| Copyright |
Copyright © The Author(s), 2024. Published by Science Publishing Group |
Average Yield, BLUPs, Cluster, Factor Analytic, Genetic Variation, Spatial, Target Environment
Locations | Latitude | Longitude | Altitude |
|---|---|---|---|
Asasa | 07°07'09"N | 39°11'50"E | 2340 |
Alem Tena | 08°18'N | 38°57'E | 1611 |
Dhera | 08°19'10"N | 39°19'13"E | 1650 |
Kulumsa | 08°01'10"N | 39°09'11"E | 2200 |
Melkasa | 08°24′N | 39°21′E | 1550 |
Sirinka | 12°15′N | 39°12′E | 1468 |
Ambo | 08°59′N | 37°51′E | 2101 |
Goro | 09°11′0"N | 38°43′0"E | 1650 |
SN | Environments | Factor1 | Factor2 | Factor3 | Factor4 | Total |
|---|---|---|---|---|---|---|
1 | 20BWNE1AA | 89.28 | 0.64 | 1.64 | 0.02 | 91.58 |
2 | 20BWNE1AT | 24.02 | 38.4 | 1.24 | 0.63 | 64.28 |
3 | 20BWNE1DR | 33.87 | 65.70 | 0 | 0.43 | 100 |
4 | 20BWNE1KU | 62.68 | 4.25 | 0.87 | 2.04 | 69.85 |
5 | 20BWNE1MK | 16.76 | 66.21 | 0.14 | 0.49 | 83.6 |
6 | 20BWNE1SK | 0.18 | 0.47 | 0.01 | 5.24 | 5.90 |
7 | 20BWNE2AA | 82.80 | 5.60 | 7.84 | 3.76 | 100 |
8 | 20BWNE2AB | 3.42 | 43.85 | 6.13 | 46.6 | 100 |
9 | 20BWNE2AT | 31.77 | 15.98 | 43.84 | 8.40 | 100 |
10 | 20BWNE2DR | 37.19 | 1.04 | 47.87 | 1.32 | 87.42 |
11 | 20BWNE2GR | 0.28 | 50.03 | 0.83 | 48.86 | 100 |
12 | 20BWNE2KU | 99.69 | 0.14 | 0.07 | 0.10 | 100 |
13 | 20BWNE2MK | 38.74 | 43.35 | 13.03 | 4.89 | 100 |
20AA | 20AT | 20DR | 20KU | 20MK | 20SK | 21AA | 21AB | 21AT | 21DR | 21GR | 21KU | 21MK | |
|---|---|---|---|---|---|---|---|---|---|---|---|---|---|
20AA | |||||||||||||
20AT | 0.40 | ||||||||||||
20DH | 0.49 | 0.79 | |||||||||||
20KU | 0.76 | 0.28 | 0.30 | ||||||||||
20MK | 0.33 | 0.70 | 0.89 | 0.14 | |||||||||
20SK | 0.03 | 0.05 | 0.07 | -0.01 | 0.09 | ||||||||
21AA | 0.84 | 0.32 | 0.33 | 0.77 | 0.18 | 0.07 | |||||||
21AB | 0.10 | 0.58 | 0.69 | 0.13 | 0.56 | -0.10 | -0.05 | ||||||
21AT | 0.42 | 0.62 | 0.67 | 0.47 | 0.51 | -0.01 | 0.55 | 0.73 | |||||
21DR | 0.50 | 0.32 | 0.28 | 0.59 | 0.13 | 0.00 | 0.75 | 0.30 | 0.79 | ||||
21GR | 0.00 | 0.40 | 0.56 | -0.21 | 0.65 | 0.21 | -0.01 | -0.02 | 0.05 | -0.18 | |||
21KU | 0.95 | 0.47 | 0.55 | 0.80 | 0.38 | 0.03 | 0.90 | 0.18 | 0.54 | 0.60 | 0.01 | ||
21MK | 0.49 | 0.74 | 0.88 | 0.36 | 0.79 | 0.13 | 0.56 | 0.49 | 0.79 | 0.54 | 0.62 | 0.58 |
SN | Environments | Mean GYD (t/ha) | Genetic Variance | Error Variance |
|---|---|---|---|---|
1 | 20BWNE1AA | 4.726 | 2.896 | 0.743 |
2 | 20BWNE1AT | 3.101 | 0.206 | 0.257 |
3 | 20BWNE1DR | 5.92 | 0.417 | 0.379 |
4 | 20BWNE1KU | 2.212 | 0.239 | 0.189 |
5 | 20BWNE1MK | 2.929 | 0.599 | 0.305 |
6 | 20BWNE1SK | 3.786 | 0.088 | 0.19 |
7 | 20BWNE2AA | 4.089 | 0.875 | 0.175 |
8 | 20BWNE2AB | 3.925 | 0.095 | 0.305 |
9 | 20BWNE2AT | 2.891 | 0.069 | 1.002 |
10 | 20BWNE2DR | 3.178 | 0.254 | 0.556 |
11 | 20BWNE2GR | 1.82 | 0.114 | 0.838 |
12 | 20BWNE2KU | 4.175 | 1.987 | 0.237 |
13 | 20BWNE2MK | 2.282 | 0.11 | 0.924 |
Genotype | 20AA | 20AT | 20DR | 20KU | 20MK | 21AA | 21AB | 21AT | 21DR | 21GR | 21KU | 21MK | Mean |
|---|---|---|---|---|---|---|---|---|---|---|---|---|---|
Atlas | 3.98 | 3.06 | 6.32 | 1.79 | 3.63 | 3.24 | 4.16 | 2.88 | 2.99 | 2.15 | 3.09 | 2.36 | 3.30 |
Balcha | 8.00 | 2.87 | 5.84 | 3.11 | 2.35 | 6.00 | 3.87 | 3.04 | 4.02 | 1.37 | 6.89 | 2.25 | 4.13 |
EBW120086 | 4.68 | 2.91 | 5.59 | 2.33 | 2.64 | 4.31 | 3.61 | 2.66 | 3.09 | 1.96 | 4.15 | 2.13 | 3.34 |
EBW120104 | 2.59 | 3.07 | 5.45 | 2.01 | 2.46 | 3.65 | 3.69 | 2.74 | 3.15 | 2.07 | 2.61 | 2.17 | 2.97 |
EBW120105 | 2.15 | 3.00 | 5.20 | 1.79 | 2.03 | 3.26 | 3.76 | 2.68 | 2.95 | 1.79 | 2.28 | 1.94 | 2.74 |
Deka | 7.09 | 2.83 | 5.81 | 2.52 | 2.58 | 5.05 | 3.59 | 2.71 | 3.25 | 1.92 | 5.47 | 2.22 | 3.75 |
EBW120101 | 4.21 | 2.43 | 5.04 | 2.04 | 1.77 | 2.84 | 3.48 | 2.12 | 1.82 | 1.64 | 3.15 | 1.45 | 2.67 |
EBW120106 | 3.31 | 2.70 | 4.95 | 2.00 | 1.83 | 3.78 | 3.66 | 2.71 | 3.29 | 1.61 | 2.78 | 1.89 | 2.88 |
EBW120109 | 2.34 | 2.80 | 5.67 | 1.71 | 2.82 | 2.52 | 4.00 | 2.66 | 2.71 | 1.97 | 1.84 | 2.01 | 2.75 |
EBW120110 | 5.75 | 3.15 | 5.82 | 2.75 | 2.39 | 5.00 | 3.82 | 2.95 | 3.69 | 1.79 | 5.04 | 2.31 | 3.71 |
EBW120111 | 6.23 | 3.21 | 6.05 | 2.72 | 3.23 | 4.71 | 3.82 | 2.81 | 3.27 | 1.90 | 5.22 | 2.27 | 3.79 |
EBW120115 | 3.48 | 2.53 | 5.43 | 1.70 | 2.37 | 2.48 | 3.85 | 2.38 | 2.12 | 1.69 | 2.58 | 1.66 | 2.69 |
EBW120116 | 1.45 | 2.52 | 4.67 | 1.59 | 1.41 | 2.54 | 3.74 | 2.53 | 2.85 | 1.51 | 1.23 | 1.60 | 2.30 |
EBW120118 | 2.26 | 3.28 | 5.79 | 1.82 | 2.59 | 2.72 | 4.28 | 2.93 | 3.21 | 1.75 | 2.01 | 2.10 | 2.90 |
EBW120125 | 1.89 | 2.62 | 5.11 | 1.56 | 2.15 | 2.89 | 3.88 | 2.67 | 3.00 | 1.62 | 1.93 | 1.82 | 2.60 |
EBW120126 | 2.58 | 2.88 | 5.43 | 2.14 | 2.34 | 3.11 | 4.16 | 2.87 | 3.24 | 1.45 | 2.59 | 1.91 | 2.89 |
EBW120135 | 4.89 | 3.18 | 6.41 | 2.49 | 3.57 | 3.68 | 4.03 | 2.72 | 2.74 | 2.09 | 4.39 | 2.26 | 3.54 |
EBW120137 | 2.43 | 2.80 | 5.30 | 1.87 | 2.19 | 2.96 | 3.91 | 2.65 | 2.92 | 1.64 | 2.37 | 1.84 | 2.74 |
EBW120149 | 2.07 | 2.68 | 5.27 | 1.67 | 2.45 | 2.59 | 3.86 | 2.52 | 2.55 | 1.71 | 2.04 | 1.76 | 2.60 |
EBW120152 | 3.59 | 2.56 | 4.77 | 1.98 | 1.17 | 2.89 | 3.90 | 2.51 | 2.79 | 1.04 | 2.73 | 1.40 | 2.61 |
EBW172060 | 5.64 | 3.25 | 6.16 | 2.15 | 2.83 | 4.15 | 4.07 | 2.94 | 3.40 | 1.88 | 4.35 | 2.32 | 3.60 |
EBW172600 | 6.46 | 3.37 | 6.64 | 2.32 | 3.80 | 3.95 | 4.11 | 2.79 | 2.78 | 2.08 | 5.00 | 2.34 | 3.80 |
EBW172604 | 5.48 | 3.06 | 6.05 | 2.07 | 3.60 | 4.02 | 3.79 | 2.65 | 2.95 | 2.06 | 4.43 | 2.19 | 3.53 |
EBW172608 | 6.70 | 4.06 | 7.23 | 2.25 | 4.60 | 4.67 | 4.25 | 3.11 | 3.49 | 2.39 | 5.67 | 2.81 | 4.27 |
EBW172619 | 5.71 | 3.40 | 6.35 | 2.39 | 3.41 | 4.25 | 3.97 | 2.83 | 3.08 | 2.06 | 4.81 | 2.36 | 3.72 |
EBW172620 | 5.92 | 3.29 | 6.32 | 2.57 | 3.00 | 4.35 | 4.17 | 2.96 | 3.29 | 1.74 | 5.10 | 2.29 | 3.75 |
EBW172627 | 5.52 | 3.13 | 5.97 | 2.18 | 2.69 | 4.36 | 3.83 | 2.83 | 3.36 | 2.00 | 4.37 | 2.30 | 3.55 |
EBW172709 | 5.37 | 2.98 | 6.08 | 2.30 | 3.09 | 4.09 | 3.75 | 2.62 | 2.67 | 2.08 | 4.62 | 2.19 | 3.49 |
EBW172713 | 4.97 | 2.68 | 5.48 | 1.93 | 2.39 | 3.97 | 3.60 | 2.57 | 2.82 | 1.90 | 3.83 | 2.00 | 3.18 |
EBW172714 | 5.09 | 3.09 | 5.79 | 2.02 | 2.78 | 4.46 | 3.70 | 2.75 | 3.21 | 2.00 | 4.41 | 2.24 | 3.46 |
EBW172771 | 5.85 | 3.61 | 6.31 | 2.13 | 3.47 | 4.09 | 3.88 | 2.73 | 2.88 | 2.15 | 4.62 | 2.32 | 3.67 |
EBW172779 | 5.87 | 3.84 | 6.98 | 2.31 | 3.90 | 4.62 | 4.43 | 3.27 | 3.67 | 2.05 | 5.32 | 2.73 | 4.08 |
EBW172797 | 5.23 | 3.32 | 6.57 | 1.95 | 3.62 | 4.57 | 4.00 | 2.99 | 3.43 | 2.28 | 4.84 | 2.61 | 3.78 |
EBW172803 | 5.52 | 3.55 | 6.95 | 2.74 | 4.06 | 3.83 | 4.41 | 3.00 | 3.03 | 2.02 | 4.94 | 2.47 | 3.88 |
EBW172827 | 6.10 | 3.65 | 6.61 | 2.27 | 3.76 | 4.45 | 4.22 | 3.07 | 3.52 | 1.98 | 5.07 | 2.51 | 3.93 |
EBW172828 | 5.58 | 3.18 | 6.47 | 2.58 | 3.62 | 4.59 | 4.17 | 3.06 | 3.50 | 1.90 | 5.17 | 2.46 | 3.86 |
EBW172831 | 6.68 | 3.52 | 6.47 | 2.67 | 3.28 | 4.31 | 4.09 | 2.81 | 3.00 | 1.85 | 5.51 | 2.26 | 3.87 |
EBW174102 | 5.07 | 3.65 | 6.53 | 2.26 | 3.21 | 3.88 | 4.30 | 3.03 | 3.27 | 1.96 | 4.30 | 2.43 | 3.66 |
EBW174116 | 7.04 | 3.85 | 7.12 | 2.33 | 4.39 | 4.29 | 4.13 | 2.89 | 2.92 | 2.42 | 5.47 | 2.65 | 4.13 |
EBW174302 | 3.63 | 3.30 | 6.27 | 1.99 | 3.13 | 3.10 | 4.40 | 2.97 | 3.15 | 1.77 | 3.23 | 2.22 | 3.26 |
EBW174334 | 4.49 | 3.42 | 6.43 | 1.72 | 3.10 | 4.68 | 4.13 | 3.10 | 3.50 | 1.98 | 4.96 | 2.54 | 3.67 |
EBW174371 | 3.51 | 3.05 | 5.97 | 2.04 | 2.99 | 3.28 | 4.00 | 2.74 | 2.81 | 2.00 | 3.15 | 2.16 | 3.14 |
EBW174374 | 2.56 | 2.75 | 6.04 | 1.55 | 3.31 | 2.79 | 4.05 | 2.76 | 2.79 | 2.20 | 2.23 | 2.24 | 2.94 |
EBW174388 | 3.19 | 2.60 | 5.90 | 1.76 | 2.76 | 3.15 | 3.96 | 2.73 | 2.84 | 2.06 | 2.78 | 2.16 | 2.99 |
EBW174389 | 4.62 | 3.06 | 5.63 | 2.12 | 2.48 | 3.84 | 3.81 | 2.72 | 3.03 | 1.82 | 3.68 | 2.07 | 3.24 |
EBW174413 | 3.84 | 3.00 | 5.61 | 1.93 | 2.71 | 3.54 | 3.95 | 2.81 | 3.16 | 1.79 | 3.08 | 2.08 | 3.13 |
EBW174425 | 2.20 | 3.06 | 6.39 | 1.61 | 3.84 | 3.01 | 3.90 | 2.75 | 2.59 | 2.71 | 2.27 | 2.53 | 3.07 |
EBW192349 | 5.55 | 3.44 | 6.68 | 2.37 | 3.88 | 5.10 | 4.04 | 3.17 | 3.64 | 2.30 | 5.26 | 2.79 | 4.02 |
EBW192350 | 7.54 | 3.37 | 6.52 | 2.86 | 3.55 | 6.08 | 3.91 | 3.17 | 4.00 | 2.02 | 6.78 | 2.71 | 4.38 |
EBW192351 | 6.06 | 3.04 | 6.10 | 2.94 | 3.01 | 5.29 | 3.84 | 2.98 | 3.65 | 1.88 | 5.69 | 2.42 | 3.91 |
EBW192352 | 5.44 | 3.24 | 6.14 | 2.52 | 2.99 | 4.86 | 4.02 | 3.07 | 3.73 | 1.86 | 4.99 | 2.44 | 3.78 |
EBW192353 | 7.26 | 3.09 | 6.04 | 2.73 | 2.71 | 4.81 | 3.87 | 2.78 | 3.27 | 1.70 | 5.78 | 2.16 | 3.85 |
EBW192357 | 5.01 | 2.38 | 5.00 | 2.67 | 1.86 | 4.86 | 3.56 | 2.75 | 3.64 | 1.45 | 4.50 | 1.92 | 3.30 |
EBW192360 | 6.65 | 2.91 | 5.46 | 3.04 | 2.28 | 5.15 | 3.75 | 2.84 | 3.61 | 1.40 | 5.56 | 2.02 | 3.72 |
EBW192361 | 5.55 | 2.94 | 5.54 | 2.13 | 2.25 | 4.61 | 3.63 | 2.71 | 3.23 | 1.79 | 4.65 | 2.09 | 3.43 |
EBW192363 | 3.91 | 3.56 | 6.37 | 2.42 | 3.31 | 3.70 | 4.30 | 3.08 | 3.40 | 1.97 | 3.60 | 2.44 | 3.51 |
EBW192364 | 5.53 | 3.03 | 6.09 | 2.62 | 2.76 | 4.70 | 4.14 | 3.13 | 3.84 | 1.71 | 4.80 | 2.39 | 3.73 |
EBW192369 | 6.08 | 3.72 | 6.47 | 3.12 | 3.32 | 5.75 | 3.98 | 3.21 | 4.00 | 2.02 | 6.11 | 2.72 | 4.21 |
EBW192370 | 6.26 | 2.73 | 5.51 | 2.72 | 2.20 | 5.02 | 3.64 | 2.85 | 3.64 | 1.77 | 4.81 | 2.21 | 3.61 |
EBW192371 | 5.77 | 2.46 | 5.34 | 2.70 | 1.68 | 4.70 | 3.82 | 2.82 | 3.50 | 1.33 | 4.89 | 1.94 | 3.41 |
EBW192375 | 5.81 | 2.85 | 5.36 | 2.48 | 2.10 | 4.95 | 3.61 | 2.80 | 3.55 | 1.66 | 4.77 | 2.10 | 3.50 |
EBW192377 | 5.81 | 2.50 | 4.88 | 2.54 | 1.47 | 4.90 | 3.50 | 2.69 | 3.52 | 1.37 | 4.64 | 1.83 | 3.30 |
EBW192380 | 5.65 | 2.90 | 5.62 | 2.31 | 2.45 | 4.94 | 3.71 | 2.89 | 3.69 | 1.81 | 4.71 | 2.26 | 3.58 |
EBW192382 | 6.07 | 2.69 | 5.28 | 2.65 | 1.79 | 5.05 | 3.57 | 2.74 | 3.39 | 1.56 | 5.09 | 2.01 | 3.49 |
ETBW9080 | 6.33 | 3.52 | 6.47 | 3.02 | 3.33 | 5.26 | 4.26 | 3.30 | 4.04 | 1.77 | 5.69 | 2.61 | 4.13 |
ETBW9172 | 5.74 | 3.15 | 6.39 | 2.83 | 3.27 | 4.72 | 4.07 | 3.02 | 3.58 | 1.96 | 5.18 | 2.47 | 3.87 |
ETBW9396 | 6.76 | 3.50 | 6.47 | 2.16 | 3.04 | 4.46 | 4.01 | 2.86 | 3.24 | 2.02 | 5.31 | 2.38 | 3.85 |
ETBW9452 | 5.85 | 3.80 | 6.57 | 2.29 | 3.48 | 4.35 | 4.02 | 2.92 | 3.02 | 2.21 | 4.85 | 2.51 | 3.82 |
ETBW9578 | 6.38 | 3.12 | 6.53 | 2.98 | 3.71 | 4.68 | 4.14 | 2.97 | 3.33 | 1.85 | 5.70 | 2.40 | 3.98 |
ETBW9581 | 5.91 | 3.38 | 6.05 | 2.66 | 3.56 | 4.99 | 3.74 | 2.88 | 3.54 | 2.08 | 5.10 | 2.43 | 3.86 |
Hawi | 1.48 | 2.89 | 5.57 | 1.50 | 2.95 | 2.93 | 3.86 | 2.79 | 3.09 | 2.20 | 1.50 | 2.22 | 2.75 |
Kakaba | 3.25 | 3.39 | 6.18 | 1.66 | 3.46 | 3.17 | 4.24 | 2.94 | 3.13 | 2.00 | 2.86 | 2.30 | 3.22 |
Kingbird | 4.81 | 3.05 | 5.61 | 2.26 | 2.51 | 4.10 | 3.76 | 2.75 | 3.34 | 1.85 | 3.85 | 2.12 | 3.33 |
Ogolcho | 0.65 | 1.86 | 4.13 | 0.92 | 1.45 | 2.15 | 2.89 | 1.88 | 1.72 | 2.16 | 0.29 | 1.40 | 1.79 |
Tesfa | 3.34 | 2.90 | 5.97 | 1.73 | 3.26 | 3.04 | 4.11 | 2.78 | 2.85 | 1.91 | 2.90 | 2.12 | 3.08 |
Mean | 4.84 | 3.08 | 5.93 | 2.25 | 2.87 | 4.09 | 3.92 | 2.83 | 3.20 | 1.88 | 4.15 | 2.22 | 3.44 |
| [1] | Alison B. Smith. Brian R. Cullis 2018. Plant breeding selection tools built on factor analytic mixed models for multi-environment trial data. Euphotic, 214: 143. |
| [2] | Assefa, A., Firew, M., Wuletaw, T., Kindie, T., 2020. Genotype×environment interaction and stability of drought tolerant bread wheat (Triticum aestivum L.) genotypes in Ethiopia. International Journal of Research Studies in Agricultural Sciences 6(3), 26–35. |
| [3] | Arzani, A.; Ashraf, M. Cultivated ancient wheat (Triticum spp.): A potential source of health-beneficial food products. Compr. Rev. Food Sci. Food Saf. 2017, 16, 477–488. |
| [4] | Becker, H. C., Leon, J., 1988. Stability analysis in plant breeding. Plant Breeding 101(1), 1–23. |
| [5] | Biasutti, C. A. and Balzarini, M., 2012. Estimation of maize hybrids performance using mixed models. AgriScientia, 29(2), pp. 59-68. |
| [6] |
Cullis, B. R., Smith, A. B., Beeck, C. P. and Cowling, W. A., 2010. Analysis of yield and oil from a series of canola breeding trials. Part II. Exploring variety by environment interaction using factor analysis. Genome, 53(11), pp. 1002-1016.
https://doi.org/10.1139/G10-080 PMID: 21076516. |
| [7] | de Sousa, T., Ribeiro, M., Sabença, C. and Igrejas, G., 2021. The 10,000-year success story of wheat! Foods, 10(9), p. 2124. |
| [8] | Dubcovsky, J.; Dvorak, J. Genome plasticity a key factor in the success of polyploid wheat under domestication. Science 2007, 316, 1862–1866. |
| [9] |
FAOSTAT. Food and Agriculture Organization. Available online:
http://www.fao.org/faostat/en/#home (accessed on 14 October 2020). |
| [10] | Fasahat, P., Rajabi, A., Mahmoudi, S. B., 2015. An overview on the use of stability parameters in plant breeding. Biometrics and Biostatistics International Journal 2(5), 149–159. |
| [11] | Giraldo, P., Benavente, E., Manzano-Agugliaro, F. and Gimenez, E., 2019. Worldwide research trends on wheat and barley: A bibliometric comparative analysis. Agronomy, 9(7), p. 352. |
| [12] | Gupta, V., Kumar, M., Singh, V., Chaudhary, L., Yashveer, S., Sheoran, R., Dalal, M. S., Nain, A., Lamba, K., Gangadharaiah, N., Sharma, R., Nagpal, S., 2022. Genotype by environment interaction analysis for grain yield of wheat (Triticum aestivum L.) genotypes. Agriculture 12, 1002. |
| [13] | Kumar, P., Yadava, R. K., Gollen, B., Kumar, S., Verma, R. K., Yadav, S., 2011. Nutritional contents and medicinal properties of wheat: A Review. Life Sciences and Medicine Research 22, 1–11. |
| [14] | Peña, R. Wheat for bread and other foods. In Bread Wheat Improvement and Production; Food and Agriculture Organization of the United Nations: Rome, Italy, 2002; pp. 483–542. |
| [15] | Piepho, H. P., Möhring, J., Melchinger, A. E. and Büchse, A., 2008. BLUP for phenotypic selection in plant breeding and variety testing. Euphytica, 161(1-2), pp. 209-228. |
| [16] | Sharifi, P., Abbasian, A., Mohaddessi, A., 2021. Evaluation the mean performance and stability of rice genotypes by combining features of AMMI and BLUP techniques and selection based on multiple traits. Plant Genetic Researches, 7(2), pp. 163-180. |
| [17] | Shewry, P. R.; Hey, S. Do “ancient” wheat species differ from modern bread wheat in their contents of bioactive components? J. Cereal Sci. 2015, 65, 236–243. |
| [18] | Smith, A. B., Cullis, B. R., 2018. Plant breeding selection tools built on factor analytic mixed models for multi-environment trial data. Euphytica, 214, pp. 1-19. |
| [19] | Tajalifar, M. and Rasooli, M., 2022. Importance of BLUP method in plant breeding. Journal of Plant Science and Phytopathology, 6(2), pp. 040-042. |
| [20] | Venske, E.; Dos Santos, R. S.; Busanello, C.; Gustafson, P.; Costa de Oliveira, A. Bread wheat: A role model for plant domestication and breeding. Hereditas 2019, 156, 16. |
APA Style
Duga, R., Alemu, G., Geleta, N., Dabi, A., Sime, B., et al. (2024). Multi Environment Trials and Adaption of Advanced Bread Wheat (Triticum aestivum L.) Genotypes in Low Moisture Stress Areas of Ethiopia. American Journal of Biological and Environmental Statistics, 10(3), 76-86. https://doi.org/10.11648/j.ajbes.20241003.15
ACS Style
Duga, R.; Alemu, G.; Geleta, N.; Dabi, A.; Sime, B., et al. Multi Environment Trials and Adaption of Advanced Bread Wheat (Triticum aestivum L.) Genotypes in Low Moisture Stress Areas of Ethiopia. Am. J. Biol. Environ. Stat. 2024, 10(3), 76-86. doi: 10.11648/j.ajbes.20241003.15
AMA Style
Duga R, Alemu G, Geleta N, Dabi A, Sime B, et al. Multi Environment Trials and Adaption of Advanced Bread Wheat (Triticum aestivum L.) Genotypes in Low Moisture Stress Areas of Ethiopia. Am J Biol Environ Stat. 2024;10(3):76-86. doi: 10.11648/j.ajbes.20241003.15
@article{10.11648/j.ajbes.20241003.15,
  author = {Rut Duga and Gadisa Alemu and Negash Geleta and Alemu Dabi and Berhanu Sime and Habtemariam Zegaye and Tafesse Solomon and Demeke Zewdu and Abebe Delesa and Bayisa Asefa and Abebe Getamesey and Tamirat Negash and Bekele Abeyo and Ayele Badebo and Yewubdar Sheweye},
  title = {Multi Environment Trials and Adaption of Advanced Bread Wheat (Triticum aestivum L.) Genotypes in Low Moisture Stress Areas of Ethiopia
},
  journal = {American Journal of Biological and Environmental Statistics},
  volume = {10},
  number = {3},
  pages = {76-86},
  doi = {10.11648/j.ajbes.20241003.15},
  url = {https://doi.org/10.11648/j.ajbes.20241003.15},
  eprint = {https://article.sciencepublishinggroup.com/pdf/10.11648.j.ajbes.20241003.15},
  abstract = {To predict bread wheat genetic potential across environments and adaption in low moisture stress wheat growing areas of Ethiopia. Multi-location trials were conducted in Ethiopia from 2020 to 2021 in main seasons. A total of advanced genotypes including the checks were arranged in randomized complete block design in a rectangular (row x column) array of plots with two replications. The results showed that, under the linear mixed model, the spatial and factor analytic models were efficient methods of data analysis for this study. By ranking average best linear unbiased prediction (BLUPs) within clusters, the 13 bread wheat environments were clustered into three mega environments (C1, C2, and C3) for the trait grain yield. This method used as a selection indicator, assisting in the selection of superior and adaptable types. The predicted performance of genotypes based on BLUP values averaged across correlated settings of C1 and C2, eliminating C3 due to low genetic correlation with the other trials and low genetic variation. Based on these clusters, the genotypes with the highest potential EBW192350 and EBW192369 were selected for a subsequent verification study that might potentially use them as a released variety. For genetic variance, the estimates for variance component parameters ranged from 0.069 to 2.896 and error variance, they ranged from 0.175 to 1.002. Therefore, increasing the application of this efficient analysis method will improve the selection of superior bread wheat varieties. The two genotypes can be further verified using national performance trials/ or verified in farmers’ fields for registration and commercialization.
},
 year = {2024}
}
TY  - JOUR
T1  - Multi Environment Trials and Adaption of Advanced Bread Wheat (Triticum aestivum L.) Genotypes in Low Moisture Stress Areas of Ethiopia

AU  - Rut Duga
AU  - Gadisa Alemu
AU  - Negash Geleta
AU  - Alemu Dabi
AU  - Berhanu Sime
AU  - Habtemariam Zegaye
AU  - Tafesse Solomon
AU  - Demeke Zewdu
AU  - Abebe Delesa
AU  - Bayisa Asefa
AU  - Abebe Getamesey
AU  - Tamirat Negash
AU  - Bekele Abeyo
AU  - Ayele Badebo
AU  - Yewubdar Sheweye
Y1  - 2024/09/26
PY  - 2024
N1  - https://doi.org/10.11648/j.ajbes.20241003.15
DO  - 10.11648/j.ajbes.20241003.15
T2  - American Journal of Biological and Environmental Statistics
JF  - American Journal of Biological and Environmental Statistics
JO  - American Journal of Biological and Environmental Statistics
SP  - 76
EP  - 86
PB  - Science Publishing Group
SN  - 2471-979X
UR  - https://doi.org/10.11648/j.ajbes.20241003.15
AB  - To predict bread wheat genetic potential across environments and adaption in low moisture stress wheat growing areas of Ethiopia. Multi-location trials were conducted in Ethiopia from 2020 to 2021 in main seasons. A total of advanced genotypes including the checks were arranged in randomized complete block design in a rectangular (row x column) array of plots with two replications. The results showed that, under the linear mixed model, the spatial and factor analytic models were efficient methods of data analysis for this study. By ranking average best linear unbiased prediction (BLUPs) within clusters, the 13 bread wheat environments were clustered into three mega environments (C1, C2, and C3) for the trait grain yield. This method used as a selection indicator, assisting in the selection of superior and adaptable types. The predicted performance of genotypes based on BLUP values averaged across correlated settings of C1 and C2, eliminating C3 due to low genetic correlation with the other trials and low genetic variation. Based on these clusters, the genotypes with the highest potential EBW192350 and EBW192369 were selected for a subsequent verification study that might potentially use them as a released variety. For genetic variance, the estimates for variance component parameters ranged from 0.069 to 2.896 and error variance, they ranged from 0.175 to 1.002. Therefore, increasing the application of this efficient analysis method will improve the selection of superior bread wheat varieties. The two genotypes can be further verified using national performance trials/ or verified in farmers’ fields for registration and commercialization.

VL  - 10
IS  - 3
ER  -
Kulumsa Agricultural Research Center, Ethiopia Institute of Agricultural Research, Asella, Ethiopia
Kulumsa Agricultural Research Center, Ethiopia Institute of Agricultural Research, Asella, Ethiopia
Kulumsa Agricultural Research Center, Ethiopia Institute of Agricultural Research, Asella, Ethiopia
Kulumsa Agricultural Research Center, Ethiopia Institute of Agricultural Research, Asella, Ethiopia
Kulumsa Agricultural Research Center, Ethiopia Institute of Agricultural Research, Asella, Ethiopia
Kulumsa Agricultural Research Center, Ethiopia Institute of Agricultural Research, Asella, Ethiopia
Kulumsa Agricultural Research Center, Ethiopia Institute of Agricultural Research, Asella, Ethiopia
Kulumsa Agricultural Research Center, Ethiopia Institute of Agricultural Research, Asella, Ethiopia
Kulumsa Agricultural Research Center, Ethiopia Institute of Agricultural Research, Asella, Ethiopia
Kulumsa Agricultural Research Center, Ethiopia Institute of Agricultural Research, Asella, Ethiopia
Kulumsa Agricultural Research Center, Ethiopia Institute of Agricultural Research, Asella, Ethiopia
Kulumsa Agricultural Research Center, Ethiopia Institute of Agricultural Research, Asella, Ethiopia
CIMMYT Ethiopia Office, Addis Ababa, Ethiopia
CIMMYT Ethiopia Office, Addis Ababa, Ethiopia
Dabra Zeit Agricultural Research Center, Ethiopia Institute of Agricultural Research, Bishoftu, Ethiopia
Information