
The global stock market is a critical mechanism for the allocation of scarce financial resources to productive economic activities. However, investors continuously face the dual challenge of minimising risk while simultaneously maximising returns. This tension becomes particularly acute during catastrophic events such as pandemics, which can severely disrupt market stability and undermine conventional investment strategies. The COVID-19 pandemic, for instance, caused significant downturns across major stock markets worldwide, highlighting the vulnerability of concentrated investment portfolios and reinforcing the importance of sound portfolio diversification strategies. This study applies Markowitz’s Modern Portfolio Theory (MPT) to nine selected stocks listed on the United States (US) stock market, spanning sectors including Technology, E-commerce, Energy, Health, Automobile, Transport, and Entertainment. Stock performance is evaluated over two distinct periods: before the pandemic (January 2018 to December 2019) and during the pandemic (January 2020 to December 2021), using data obtained from Yahoo Finance. The expected returns of the selected stocks are estimated using the Capital Asset Pricing Model (CAPM). A diversified portfolio is then formulated, the Sharpe ratio is computed for risk-adjusted performance evaluation, and the efficient frontier is constructed using Monte Carlo simulation implemented in Python. The simulation generates 2,000 portfolio scenarios to identify the optimal risky portfolio. The results demonstrate that a well-diversified portfolio can yield superior risk-adjusted returns, with the optimal portfolio achieving a Sharpe ratio of 1.21 at a return of 27.02% and a standard deviation of 22.36%. These findings underscore the effectiveness of MPT and Monte Carlo simulation as practical tools for optimal portfolio selection, particularly in the context of catastrophic market events.
| Published in | American Journal of Applied Mathematics (Volume 14, Issue 4) |
| DOI | 10.11648/j.ajam.20261404.13 |
| Page(s) | 199-209 |
| Creative Commons |
This is an Open Access article, distributed under the terms of the Creative Commons Attribution 4.0 International License (http://creativecommons.org/licenses/by/4.0/), which permits unrestricted use, distribution and reproduction in any medium or format, provided the original work is properly cited. |
| Copyright |
Copyright © The Author(s), 2026. Published by Science Publishing Group |
Stock Market, Asset Allocation, Diversification, Optimal Risky Portfolio, Capital Asset Pricing Model
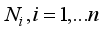 securities available to an investor. Suppose further that a proportion
  is invested in security
  .
.  is a fraction of the total sum to be invested and can assume any value along the real line subject to the constraint that
  . The return on the portfolio is
 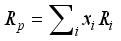 , where
  is the return on security
  . The expected return on the portfolio is
 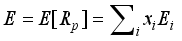 (1)
(1)  is the expected return on security
  . The variance of the portfolio is
 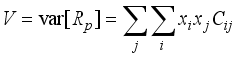 (2)
(2)  is the covariance of the returns on securities.
  securities, the aim is to choose
  to minimise variance (the statistical measure for risk)
  subject to the constraints:
  and
and  . The goal is to minimise the portfolio variance,
  subject to the two constraints
  and
and  . The Lagrangian function for minimisation is
  (3)
(3)  and
and  are the Lagrangian multipliers in this case. We are trying to minimize the variance
  subject to the expected return and ’all money invested’ constraints.
  with respect to all the
  and
and  and
and  equal to zero minimizes
  with
with 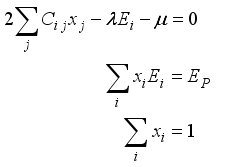 (4)
(4)  , a portfolio of risky assets
  and
and  , a portfolio of just one risk-free asset
  ,
,  can be expressed in terms of
  as:
as: 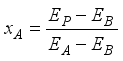 (5)
(5)  (6)
(6)  and
and  since portfolio
  is risk-free. The variance simplifies to
 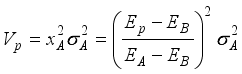 (7)
(7)  space. The efficient frontier with a risk-free asset is parabolic in
  space. The straight line above in the expected return standard deviation space is a degenerate case of a hyperbola. The assumption is that a rational investor would hold a combination of the risk-free asset and
  , the portfolio of risky assets at the point where the straight line of the risk-free return touches the original efficient frontier. The straight line denoting the new efficient frontier is called the Capital Market Line (CML) and has the equation:
 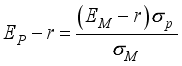 (8)
(8)  is the expected return of any portfolio on the efficient frontier.
  is the standard deviation of the return on the portfolio.
  is the expected return on the market portfolio.
  is the standard deviation of the return on the market portfolio.
 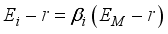 (9)
(9)  is the expected return on security
  ,
,  is the return on the risk-free asset,
  is the expected return on the market portfolio,
  is the beta factor of security
  defined as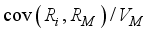
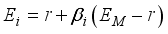 (10)
(10)  space called the Security Market Line (SML). This line shows that the expected return on an asset is linearly related to its systematic risk as measured by beta.
  (11)
(11)  is the expected portfolio return,
  is the risk-free rate, and
  is the standard deviation of the portfolio return. A higher Sharpe ratio indicates a more favourable risk-adjusted return. In the context of portfolio optimisation using Monte Carlo simulation, the Sharpe ratio serves as the primary criterion for selecting the optimal risky portfolio from among the many feasible portfolios on the efficient frontier. The portfolio with the maximum Sharpe ratio represents the best possible trade-off between risk and return, and is referred to as the tangency portfolio or the optimal risky portfolio. In this study, a zero risk-free interest rate is assumed in the computation of the Sharpe ratio.
 Stock | Alpha | Beta | Expected Return (%) |
|---|---|---|---|
AZN | 0.00 | 0.70 | 8.96 |
AMZN | 0.08 | 1.00 | 12.88 |
NTFL | 0.11 | 1.05 | 13.47 |
AAPL | 0.06 | 1.08 | 13.84 |
DAL | 0.03 | 1.24 | 15.90 |
T | -0.03 | 0.69 | 8.85 |
JNJ | 0.01 | 0.66 | 8.48 |
BA | 0.00 | 1.35 | 17.29 |
Stock | AZN | AMZN | NTFL | AAPL | DAL | T | JNJ | BA | S&P500 |
|---|---|---|---|---|---|---|---|---|---|
AZN | 0.059 | 0.020 | 0.024 | 0.022 | 0.021 | 0.014 | 0.018 | 0.023 | 0.021 |
AMZN | 0.100 | 0.067 | 0.041 | 0.029 | 0.014 | 0.017 | 0.031 | 0.031 | |
NTFL | 0.258 | 0.039 | 0.037 | 0.012 | 0.016 | 0.034 | 0.032 | ||
AAPL | 0.083 | 0.034 | 0.018 | 0.018 | 0.040 | 0.033 | |||
DAL | 0.165 | 0.028 | 0.020 | 0.084 | 0.038 | ||||
T | 0.040 | 0.017 | 0.030 | 0.021 | |||||
JNJ | 0.031 | 0.024 | 0.020 | ||||||
BA | 0.134 | 0.041 | |||||||
S&P500 | 0.031 |
Optimal Portfolio | Metric (%) |
|---|---|
Return | 0.2702 |
Volatility | 0.2236 |
Sharpe Ratio | 1.2120 |
Stock | AZN | AMZN | NTFL | AAPL | DAL | T | JNJ | BA | S&P500 |
|---|---|---|---|---|---|---|---|---|---|
Weight (%) | 0.07 | 0.27 | 0.11 | 0.16 | 0.07 | 0.01 | 0.23 | 0.04 | 0.02 |
MPT | Modern Portfolio Theory |
CAPM | Capital Asset Pricing Mode |
US | United States |
SVM | Support Vector Machine |
ARIMA | Auto-Regressive Integrated Moving Average |
MLP | Multi-layer Perceptron |
CML | Capital Market Line |
SML | Security Market Line |
OLS | Ordinary Least Squares |
MINLP | Mixed-Integer Nonlinear Programming |
S&P500 | Standard and Poor’s 500 Index |
COVID-19 | Coronavirus Disease-2019 |
AMZN | Amazon |
BABA | Alibaba |
SE | Sea Limited |
XOM | Exxon Mobil |
NEE | NextEra Energy |
SHEL | Shell |
DIS | Walt Disney Company |
NFLX | Netflix |
FB | Facebook/Meta |
F | Ford Motor |
TSLA | Tesla |
TM | Toyota Motor |
UNH | United Health Group Incorporated |
ABBV | AbbVie Inc. |
ABT | Abbot Laboratories |
BA | Boeing |
DAL | Delta Airlines |
AAL | American Airlines Group |
| [1] | Author Ravikumar, S. and Saraf, P. (2020), 'Prediction of stock prices using machine learning (regression, classification) algorithms', 2020 International Conference for Emerging Technology (INCET). IEEE, pp. 1-5. |
| [2] | Mondal, P., Shit, L. and Goswami, S., (2014), 'Study of effectiveness of time series modeling (ARIMA) in forecasting stock prices’. International Journal of Computer Science, Engineering and Applications, 4(2), p. 13. |
| [3] | Reddy, V. K. S. and Sai, K. (2018) 'Stock market prediction using machine learning', International Research Journal of Engineering and Technology (IRJET), 5(10), pp. 1033-1035. |
| [4] | Leung, C. K. S., MacKinnon, R. K. and Wang, Y. (2014) 'A machine learning approach for stock price prediction', Proceedings of the 18th International Database Engineering & Applications Symposium, pp. 274-277. |
| [5] | Vijh, M., Chandola, D., Tikkiwal, V. A. and Kumar, A. (2020) 'Stock closing price prediction using machine learning techniques', Procedia Computer Science, 167, pp. 599-606. |
| [6] | Obthong, M., Tantisantiwong, N., Jeamwatthanachai, W. and Wills, G. A survey on machine learning for stock price prediction: algorithms and techniques. Proceedings of the 2020 International Conference on Finance, Economics, Management and IT Business, (202) pp. 63-71. |
| [7] | Nikou, M., Mansourfar, G. and Bagherzadeh, J. (2019) 'Stock price prediction using deep learning algorithm and its comparison with machine learning algorithms', Intelligent Systems in Accounting, Finance and Management, 26(4), pp. 164-174. |
| [8] | Mehtab, S., Sen, J. and Dutta, A. (2020) 'Stock price prediction using machine learning and LSTM-based deep learning models', Symposium on Machine Learning and Metaheuristics Algorithms, and Applications. Singapore: Springer, pp. 88-106. |
| [9] | Prasad, V. V., Gumparthi, S., Venkataramana, L. Y., Srinethe, S., Sruthi Sree, R. M. and Nishanthi, K. (2022) 'Prediction of stock prices using statistical and machine learning models: a comparative analysis', The Computer Journal, 65(5), pp. 1338-1351. |
| [10] | Markowitz, H. M. (1999) 'The early history of portfolio theory: 1600-1960', Financial Analysts Journal, 55(4), pp. 5-16. |
| [11] | Tobin, J. (1958) 'Liquidity preference as behavior towards risk', The Review of Economic Studies, 25(2), pp. 65-86. |
| [12] | Sharpe, W. F. (1964) 'Capital asset prices: A theory of market equilibrium under conditions of risk', The Journal of Finance, 19(3), pp. 425-442. |
| [13] | Affleck-Graves, J. and Money, A. (1976) 'A comparison of two portfolio selection models', Investment Analysts Journal, 5(7), pp. 35-40. |
| [14] | Lee, H.-S., Cheng, F.-F. and Chong, S.-C. (2016) 'Markowitz portfolio theory and capital asset pricing model for Kuala Lumpur stock exchange: A case revisited', International Journal of Economics and Financial Issues, 6(3S). |
| [15] | Bonami, P. and Lejeune, M. A. (2009) 'An exact solution approach for portfolio optimization problems under stochastic and integer constraints', Operations Research, 57(3), pp. 650-670. |
| [16] |
Ao, M., Li, Y. and Zheng, X. (2017) 'Solving the Markowitz optimization problem for large portfolios. Available at:
http://fmaconferences.org/SanDiego/Papers/MAXSER_MengmengAo.pdf |
| [17] | Alekneviciene, V., Alekneviciute, E. and Rinkeviciene, R. (2012) 'Portfolio size and diversification effect in Lithuanian stock exchange market', Engineering Economics, 23(4), pp. 338-347. |
| [18] | Fama, E. F. and French, K. R. (2004) 'The capital asset pricing model: Theory and evidence', Journal of Economic Perspectives, 18(3), pp. 25-46. |
| [19] | Perold, A. F. (2004) 'The capital asset pricing model', Journal of Economic Perspectives, 18(3), pp. 3-24. |
APA Style
Arhinful, D. A., Ampofi, I., Asiedu, E. L. (2026). Optimal Portfolio Selection Under Catastrophic Events Using Monte Carlo Simulation. American Journal of Applied Mathematics, 14(4), 199-209. https://doi.org/10.11648/j.ajam.20261404.13
ACS Style
Arhinful, D. A.; Ampofi, I.; Asiedu, E. L. Optimal Portfolio Selection Under Catastrophic Events Using Monte Carlo Simulation. Am. J. Appl. Math. 2026, 14(4), 199-209. doi: 10.11648/j.ajam.20261404.13
@article{10.11648/j.ajam.20261404.13,
  author = {Daniel Andoh Arhinful and Isaac Ampofi and Ebenezer Larbi Asiedu},
  title = {Optimal Portfolio Selection Under Catastrophic Events Using Monte Carlo Simulation},
  journal = {American Journal of Applied Mathematics},
  volume = {14},
  number = {4},
  pages = {199-209},
  doi = {10.11648/j.ajam.20261404.13},
  url = {https://doi.org/10.11648/j.ajam.20261404.13},
  eprint = {https://article.sciencepublishinggroup.com/pdf/10.11648.j.ajam.20261404.13},
  abstract = {The global stock market is a critical mechanism for the allocation of scarce financial resources to productive economic activities. However, investors continuously face the dual challenge of minimising risk while simultaneously maximising returns. This tension becomes particularly acute during catastrophic events such as pandemics, which can severely disrupt market stability and undermine conventional investment strategies. The COVID-19 pandemic, for instance, caused significant downturns across major stock markets worldwide, highlighting the vulnerability of concentrated investment portfolios and reinforcing the importance of sound portfolio diversification strategies. This study applies Markowitz’s Modern Portfolio Theory (MPT) to nine selected stocks listed on the United States (US) stock market, spanning sectors including Technology, E-commerce, Energy, Health, Automobile, Transport, and Entertainment. Stock performance is evaluated over two distinct periods: before the pandemic (January 2018 to December 2019) and during the pandemic (January 2020 to December 2021), using data obtained from Yahoo Finance. The expected returns of the selected stocks are estimated using the Capital Asset Pricing Model (CAPM). A diversified portfolio is then formulated, the Sharpe ratio is computed for risk-adjusted performance evaluation, and the efficient frontier is constructed using Monte Carlo simulation implemented in Python. The simulation generates 2,000 portfolio scenarios to identify the optimal risky portfolio. The results demonstrate that a well-diversified portfolio can yield superior risk-adjusted returns, with the optimal portfolio achieving a Sharpe ratio of 1.21 at a return of 27.02% and a standard deviation of 22.36%. These findings underscore the effectiveness of MPT and Monte Carlo simulation as practical tools for optimal portfolio selection, particularly in the context of catastrophic market events.},
 year = {2026}
}
TY  - JOUR
T1  - Optimal Portfolio Selection Under Catastrophic Events Using Monte Carlo Simulation
AU  - Daniel Andoh Arhinful
AU  - Isaac Ampofi
AU  - Ebenezer Larbi Asiedu
Y1  - 2026/07/17
PY  - 2026
N1  - https://doi.org/10.11648/j.ajam.20261404.13
DO  - 10.11648/j.ajam.20261404.13
T2  - American Journal of Applied Mathematics
JF  - American Journal of Applied Mathematics
JO  - American Journal of Applied Mathematics
SP  - 199
EP  - 209
PB  - Science Publishing Group
SN  - 2330-006X
UR  - https://doi.org/10.11648/j.ajam.20261404.13
AB  - The global stock market is a critical mechanism for the allocation of scarce financial resources to productive economic activities. However, investors continuously face the dual challenge of minimising risk while simultaneously maximising returns. This tension becomes particularly acute during catastrophic events such as pandemics, which can severely disrupt market stability and undermine conventional investment strategies. The COVID-19 pandemic, for instance, caused significant downturns across major stock markets worldwide, highlighting the vulnerability of concentrated investment portfolios and reinforcing the importance of sound portfolio diversification strategies. This study applies Markowitz’s Modern Portfolio Theory (MPT) to nine selected stocks listed on the United States (US) stock market, spanning sectors including Technology, E-commerce, Energy, Health, Automobile, Transport, and Entertainment. Stock performance is evaluated over two distinct periods: before the pandemic (January 2018 to December 2019) and during the pandemic (January 2020 to December 2021), using data obtained from Yahoo Finance. The expected returns of the selected stocks are estimated using the Capital Asset Pricing Model (CAPM). A diversified portfolio is then formulated, the Sharpe ratio is computed for risk-adjusted performance evaluation, and the efficient frontier is constructed using Monte Carlo simulation implemented in Python. The simulation generates 2,000 portfolio scenarios to identify the optimal risky portfolio. The results demonstrate that a well-diversified portfolio can yield superior risk-adjusted returns, with the optimal portfolio achieving a Sharpe ratio of 1.21 at a return of 27.02% and a standard deviation of 22.36%. These findings underscore the effectiveness of MPT and Monte Carlo simulation as practical tools for optimal portfolio selection, particularly in the context of catastrophic market events.
VL  - 14
IS  - 4
ER  -
Department of Mathematical Sciences, University of Mines and Technology, Tarkwa, Ghana
Biography: Daniel Andoh Arhinful is a lecturer at the Department of Mathematical Sciences of the University of Mines and Technology (UMaT). He completed his PhD at UMaT in 2025 and his Master of Mathematical Engineering from the University of L’Aquila, Italy, and Brno University of Technology in the Czech Republic. He has an interest in Finance, Dynamical Systems and Chaos Theory, and Mathematical Modelling.
Research Fields: Dynamical Systems, Control Systems, Mathematical Epidemiology, Financial Modelling

Department of Mathematical Sciences, University of Mines and Technology, Tarkwa, Ghana
Biography: Isaac Ampofi is a lecturer at the University of Mines and Technology, Mathematical Sciences Department. He completed his Master of Financial Mathematics in 2020 at UMaT. He has been on his PhD since 2023. He holds national awards, including a scholarship from the Ghana National Petroleum Commission (GNPC). His areas of specialization are Financial and Economic Modelling, Financial Derivatives, and Machine Learning and Artificial Intelligence.
Research Fields: Financial and Economic Modelling, Financial Derivatives, Machine Learning and Artificial Intelligence

Department of Mathematical Sciences, University of Mines and Technology, Tarkwa, Ghana
Biography: Ebenezer Larbi Asiedu is a Mathematics lecturer at the Department of Mathematical Sciences of UMaT. He holds a PhD and a Master's degree in Mathematics from UMaT. He researches into areas including Disease Modelling, Applied Mathematics, Machine Learning, and Artificial Intelligence.
Research Fields: Financial and Economic Modelling, Applied Mathematics, Disease Modelling, Machine Learning and Artificial Intelligence

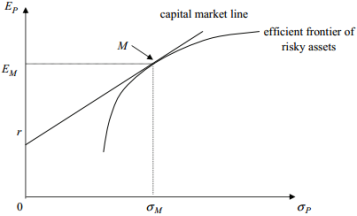
Figure 1. The Efficient Frontier with Risk-free Asset.
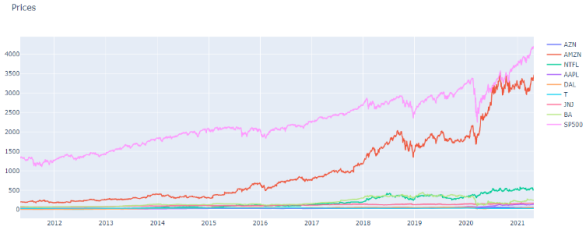
Figure 2. Closing Price of Stocks.
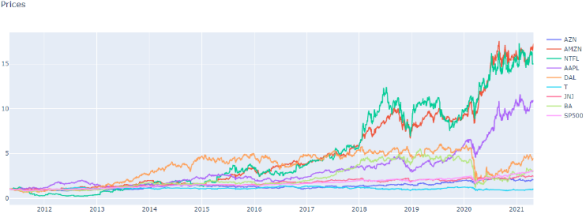
Figure 3. Normalized Closing Price of Stocks.
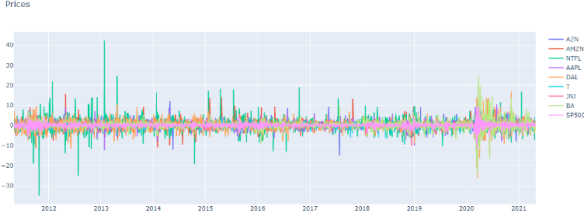
Figure 4. Daily Return of Stocks.
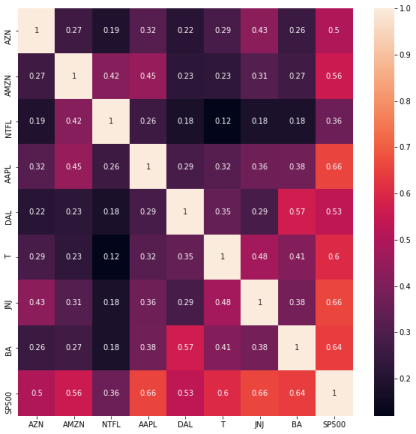
Figure 5. Correlation of Stock Returns.
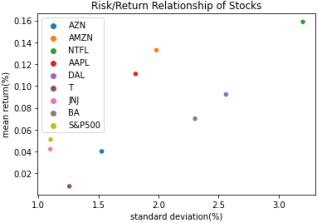
Figure 6. Risk-Return of Stocks.
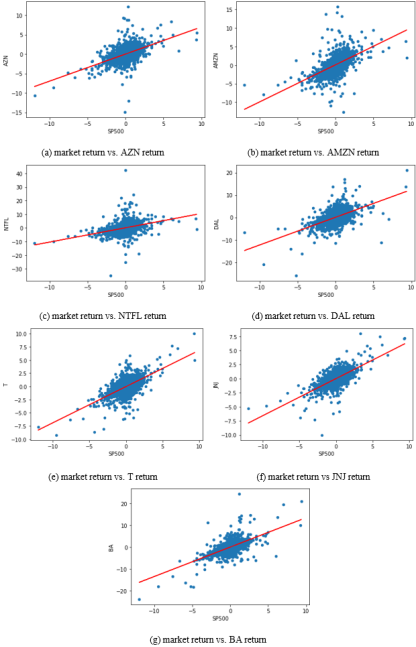
Figure 7. Market Returns vs Stock Returns.
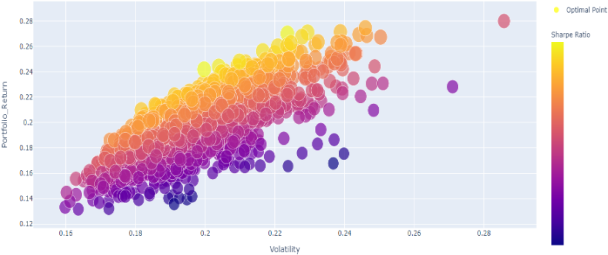
Figure 8. Efficient Frontier.

Information



 Share This Article
 Twitter
 Linked In
 Facebook
 Copy
Copy Download